Continuing my series on using Power Bi with my DBA Database I am going to show in this post how I create the most useful daily report for DBAs - The SQL Agent Job report. You can get the scripts and reports here
Please note this project became dbareports.io
This gives a quick overview of the status of the Agent Jobs across the estate and also quickly identifies recent failed jobs enabling the DBA to understand their focus and prioritise their morning efforts.
I gather the information into 2 tables AgentJobDetail
| |
and AgentJobServer
| |
The Detail table holds the results of every Agent Job and the Server table holds a roll up for each server. The script to gather this information is based on the script I used to put the information into an Excel Sheet as described in my post How I Check Hundreds of Agent Jobs in 60 Seconds with PowerShell which I also altered to send an HTML email to the DBA team each morning. This however is a much better solution and allows for better monitoring and trending.
As I have explained in my previous posts I use an Instance List table to hold the information about each instance in the estate and a series of PowerShell scripts which run via Agent Jobs to gather the information into various tables. These posts describe the use of the Write-Log function and the methodology of gathering the required information and looping through each instance so I wont repeat that here. There is an extra check I do however for Express Edition as this does not contain the Agent service
| |
The Agent Job information can be found in SMO by exploring the $srv.JobServer.Jobs object and I gather the information by iterating through each job and setting the values we require to variables
| |
I found that some Jobs had names and descriptions that had ’ in them which would cause the SQL update or insert statement to fail so I use the replace method to replace the ’ with ''
| |
I then insert the data per job after checking that it does not already exist which allows me to re-run the job should a number of servers be uncontactable at the time of the job running without any additional work
| |
I put this in a here-string variable and pass it to Invoke-SQLCmd I do the same with the roll up using this query
| |
This job runs as a SQL Agent Job every morning a half an hour or so before the DBA arrives for the morning shift vastly improving the ability of the DBA to prioritise their morning routine.
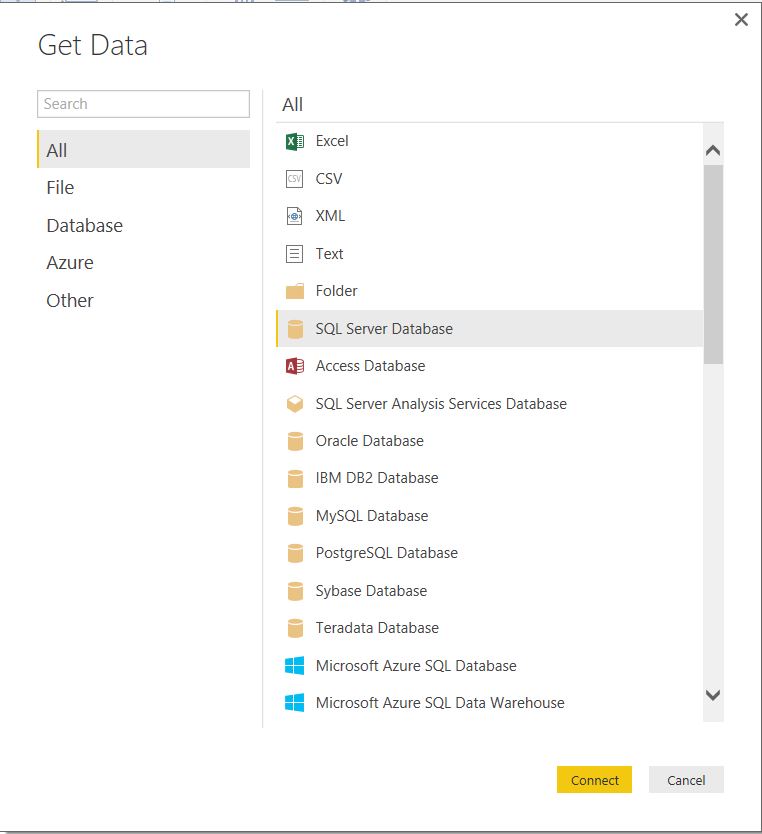
To create the report open Power Bi Desktop and click Get Data
Then choose SQL Server and click connect
Enter the Connection string, the database and the query to gather the data
The query is
| |
Once we have gathered the data we then create some extra columns and measures for the reports. First I create a date column from the datetime Date Column
| |
I also do the same for the LastRuntime. I create a day of the week column so that I can report on jobs outcome by day
| |
My friend Terry McCann b | t helped me create a column that returns true if the last run time is within 24 hours of the current time to help identify the recent jobs that have failed NOTE - On a Monday morning you will need to change this if you do not check your jobs on the weekend.
| |
I create a measure for Succeeded, Failed and Unknown
| |
Next we have to create some measures for the sum of failed jobs and the averages This is the code for 7 day sum
| |
and for the 7 Day average
| |
I did the same for 30 days. I used the TechNet reference for DAX expressions and got ideas from Chris Webbs blog
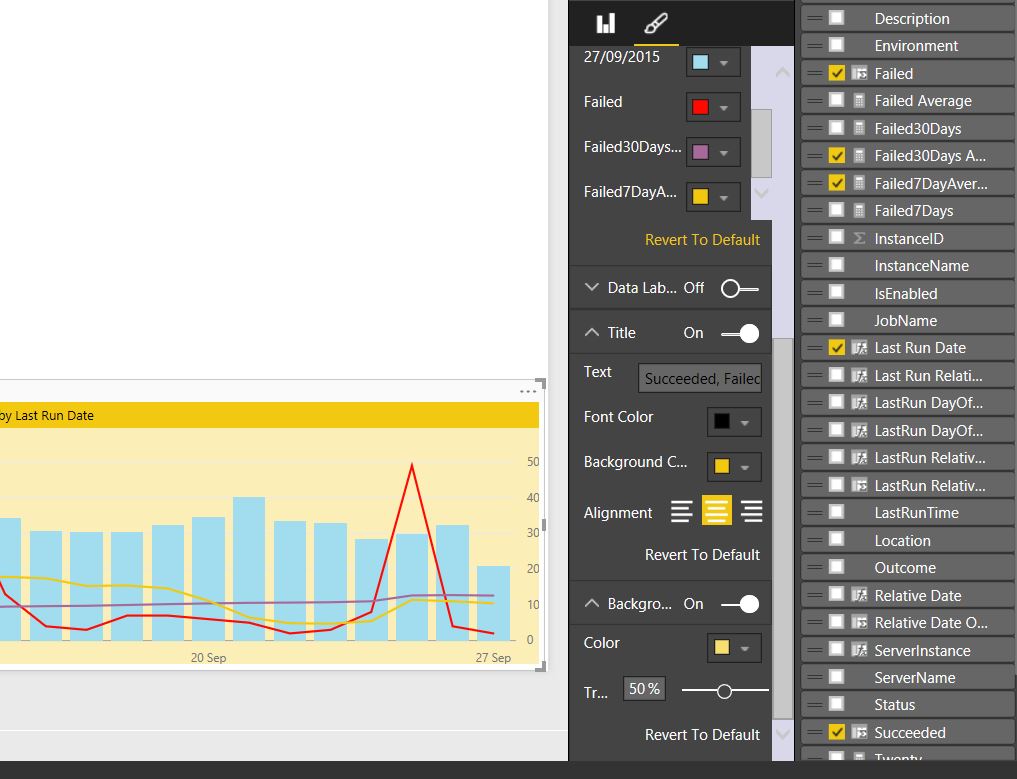
 First I created the 30 day historical trend chart using a Line and Clustered column chart using the last run date as the axis and the succeed measure as the column and the Failed, Failed 7 Day Average and failed 30 day average as the lines
I then formatted the lines and title and column
To create the gauge which shows how well we have done today I created a measure to quickly identify todays jobs
| |
which I use as a filter for the gauge as shown below. I also create two measures zero and twenty for the minimum and maximum for the gauge
The rest of the report is measures for 7 day average and 30 day average, a slicer for environment and two tables, one to show the historical job counts and one to show the jobs that have failed in the last 24 hours using the Last Run Relative Hour measure from above
There are many other reports that you can or may want to create maybe by day of the week or by category depending on your needs. Once you have the data gathered you are free to play with the data as you see fit. Please add any further examples of reports you can run or would like to run in the comments below.
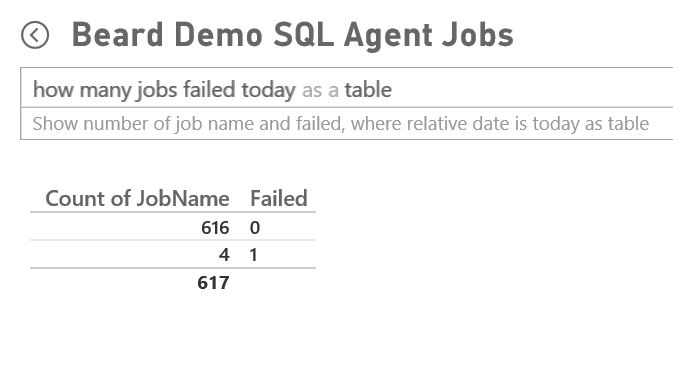
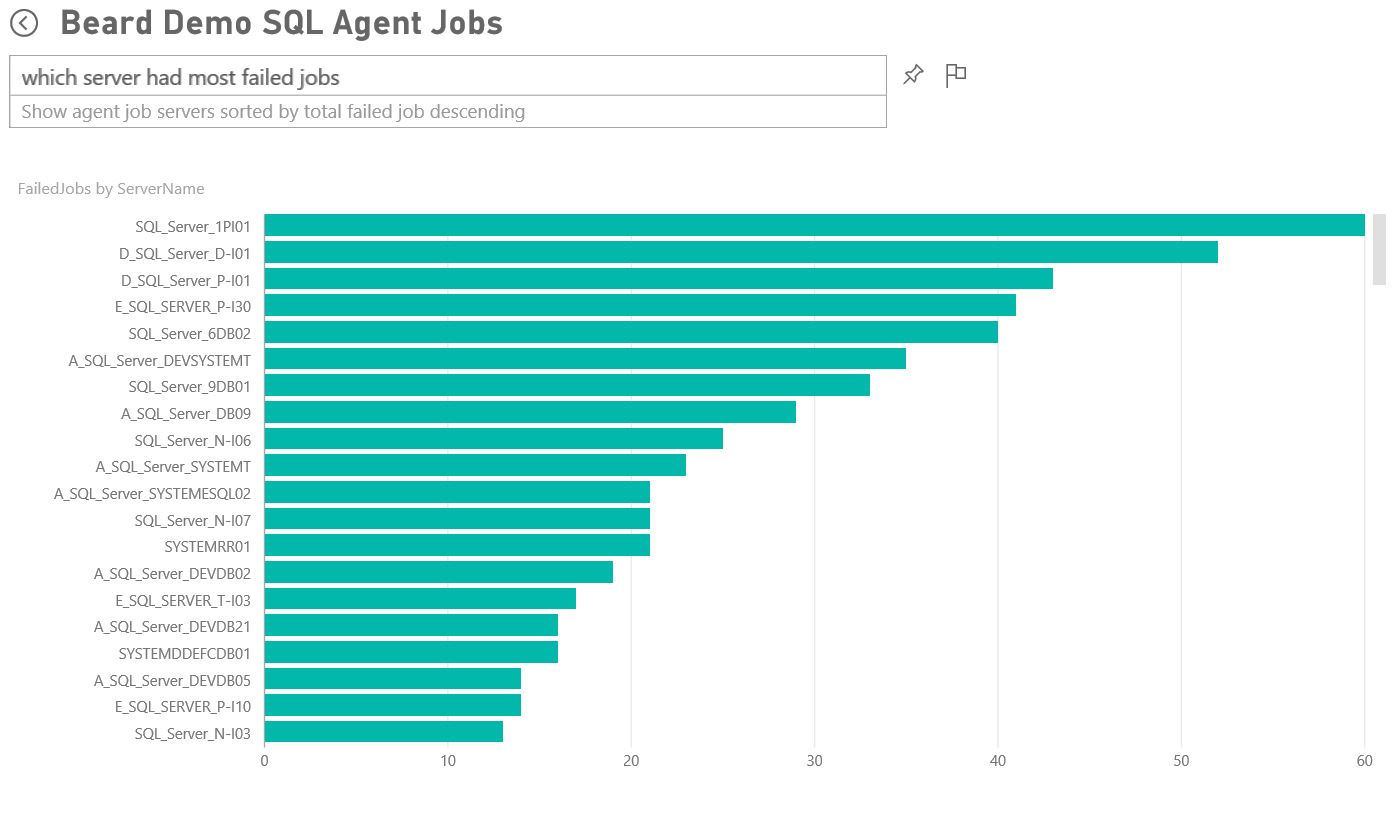
Once you have your report written you can publish it to PowerBi.com and create a dashboard and query it with natural language. I have explained the process in previous posts
For example - How many Jobs failed today
Which server had most failed jobs
or using the category field which database maintenance jobs failed today
I hope these posts have given you ideas about how you can use PowerShell, a DBA Database and Power Bi to help you to manage and report on your environment.
You can get the scripts and reports here
I have written further posts about this
Using Power Bi with my DBA Database
Populating My DBA Database for Power Bi with PowerShell – Server Info
Populating My DBA Database for Power Bi with PowerShell – SQL Info
Populating My DBA Database for Power Bi with PowerShell – Databases


