Following my last post about using Power Bi with my DBA Database I have been asked if I would share the PowerShell scripts which I use to populate my database. They are the secondary part to my DBADatabase which I also use to automate the installation and upgrade of all of my DBA scripts as I started to blog about in this post Installing and upgrading default scripts automation - part one - Introduction which is a series I will continue later.
In this post I will show how to create the following report
You will find the latest version of my DBADatabase creation scripts here.
I create the following tables
- dbo.ClientDatabaseLookup
- dbo.Clients
- dbo.InstanceList
- dbo.InstanceScriptLookup
- dbo.ScriptList
- Info.AgentJobDetail
- Info.AgentJobServer
- Info.Databases
- Info.Scriptinstall
- Info.ServerOSInfo
- Info.SQLInfo
By adding Server name, Instance Name , Port, Environment, NotContactable, and Location into the InstanceList table I can gather all of the information that I need and also easily add more information to other tables as I need to.
The not contactable column is so that I am able to add instances that I am not able to contact due to permission or environment issues. I can still gather information about them manually and add it to the table. I use the same script and change it to generate the SQL query rather than run it, save the query and then run the query manually to insert the data. This is why I have the DateAdded and Date Checked column so that I know how recent the data is. I don’t go as far as recording the change however as that will be added to a DBA-Admin database on every instance which stores every change to the instance.
The ServerOSInfo table is created like so
| |
The PowerShell script uses Jason Wasser @wasserja Write-Log function to write to a text file but I also enable some logging into a new event log by following the steps here http://blogs.technet.com/b/heyscriptingguy/archive/2013/02/01/use-PowerShell-to-create-and-to-use-a-new-event-log.aspx to create a log named SQLAutoScript with a source SQLAUTOSCRIPT
To run the script I simply need to add the values for
| |
And the script will do the rest. Call the script from a PowerShell Job Step and schedule it to run at the frequency you wish, I gather the information every week. You can get the script from here or you can read on to see how it works and how to create the report
I create a function called Catch-Block to save keystrokes and put my commands inside a try catch to make the scripts as robust as possible.
| |
I give the function an additional parameter which will hold each custom error message which I write to both the event log and a text message to enable easy troubleshooting and include the message from the $Error variable by accessing it with $_. I won’t include the try catch in the examples below. I gather all of the server names from the InstanceList table and set the results to an array variable called $Servers
| |
I then loop through the array and gather the information with three WMI queries.
| |
I give the variables some default values in case they are not picked up and set the error action for the command to Stop to exit the try and the first query gathers the DNSHostName, Domain Name, the amount of RAM in GB and the number of logical processors, the second gathers the Operating System version but the third was the most interesting to do. There are many methods of gathering the IP Address using PowerShell and I tried a few of them before finding one that would work with all of the server versions that I had in my estate but the one that worked remotely the best for me and this is a good point to say that this works in my lab and in my shop but may not necessarily work in yours, so understand, check and test this and any other script that you find on the internet before you let them anywhere near your production environment.
Unfortunately the one that worked everywhere remotely errored with the local server so I added a check to see if the server name in the variable matches the global environment variable of Computer Name
| |
Once I have all of the information I check if the server already exists in the ServerOs table and choose to either insert or update.
| |
get-wmiobject Win32_OperatingSystem -ComputerName $Server | Get-Member get-wmiobject win32_computersystem -ComputerName $Server | Get-Member
| |
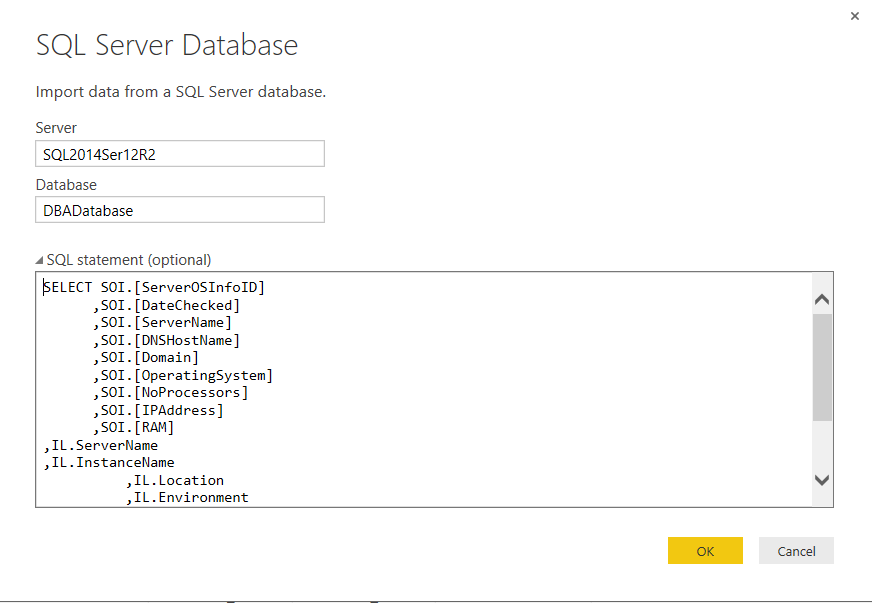
SELECT SOI.[ServerOSInfoID]
      ,SOI.[DateChecked]
      ,SOI.[ServerName]
      ,SOI.[DNSHostName]
      ,SOI.[Domain]
      ,SOI.[OperatingSystem]
      ,SOI.[NoProcessors]
      ,SOI.[IPAddress]
      ,SOI.[RAM]
,IL.ServerName
,IL.InstanceName
	  ,IL.Location
	  ,IL.Environment
	  ,IL.Inactive
	  ,IL.NotContactable
        FROM [DBADatabase].[Info].[ServerOSInfo] as SOI
  JOIN [dbo].[InstanceList] as IL
  ON IL.ServerName =  SOI.[ServerName]
```
Create a new column for the Operating Edition by clicking data on the left and using this code as described in my previous post
| |
And one for OS Version using this code
| |
I also created a new measure to count the distinct number of servers and instances as follows
| |
Then in the report area I start by creating a new text box and adding a title to the report and setting the page level filter to InActive is false so that all decommissioned servers are not included
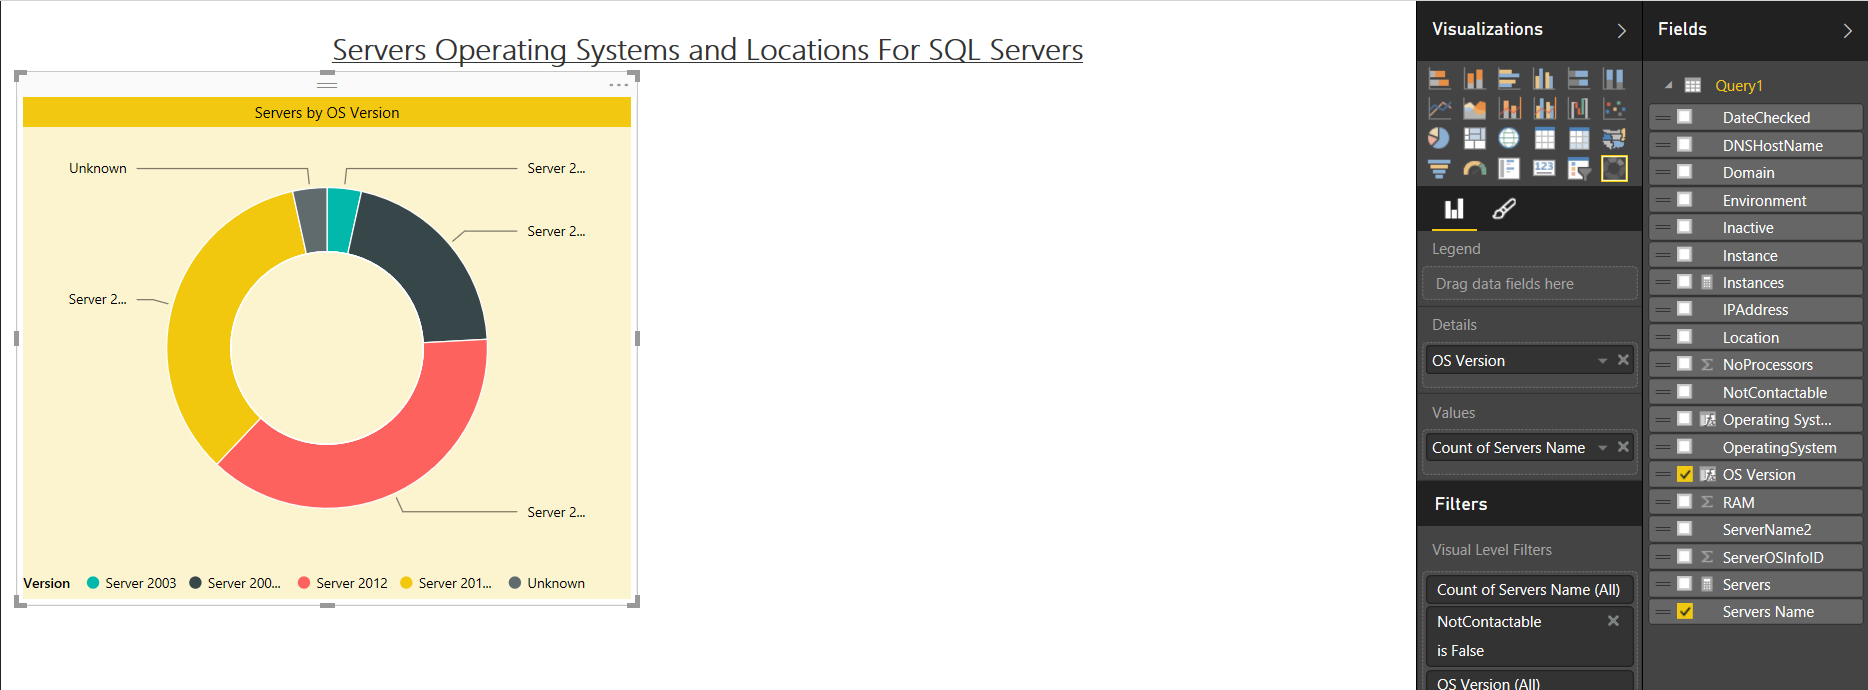
I then create a donut chart for the number of servers by Operating System by clicking the donut chart in the visualisations and then dragging the OS version to the Details and the Servers Name to the Values
I then click the format button and added a proper title and the background colour
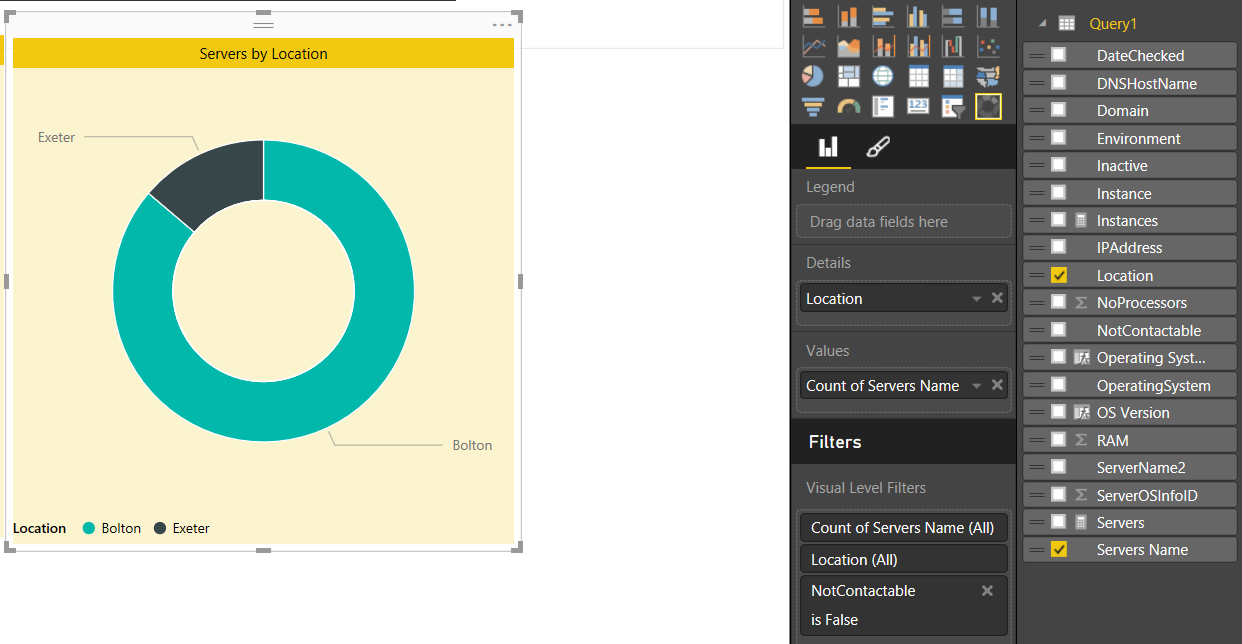
Then create the server numbers by location in the same way by clicking donut chart and adding location and count of server names and adding the formatting in the same way as the previous donut
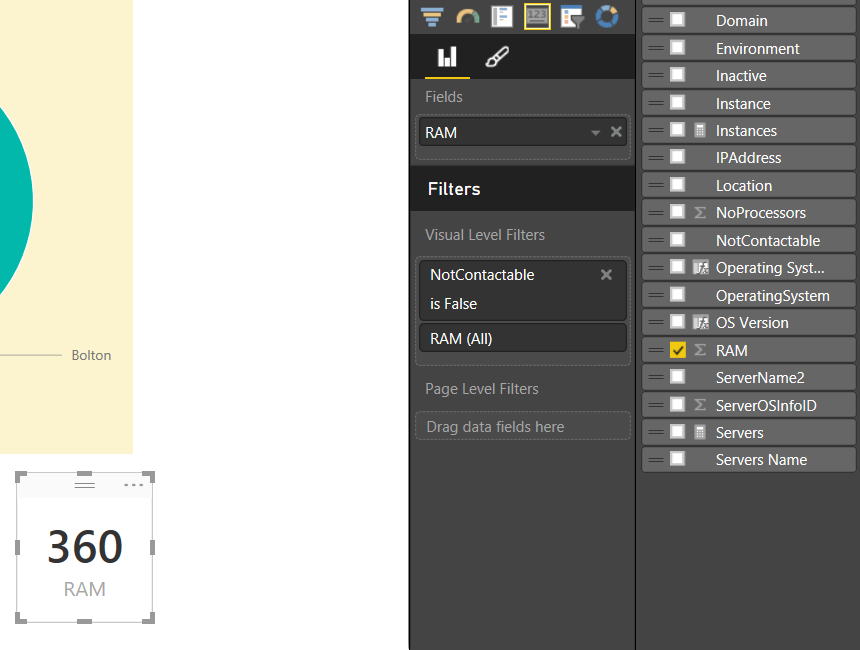
I created a number of charts to hold single values for Domain, Instance, Server, RAM, Processors and the number of Not Contactable to provide a quick easy view of those figures, especially when you filter the report by clicking on a value within the donut chart. I find that managers really like this feature. They are all created in the same way by clicking the card in the visualisation and choosing the value
I also add a table for the number of servers by operating system and the number of servers by location by dragging those values to a table visualisation. I find that slicers are very useful ways of enabling information to be displayed as required, use the live visualisation to do this, I add the environment column to slice so that I can easily see values for the live environment or the development environment
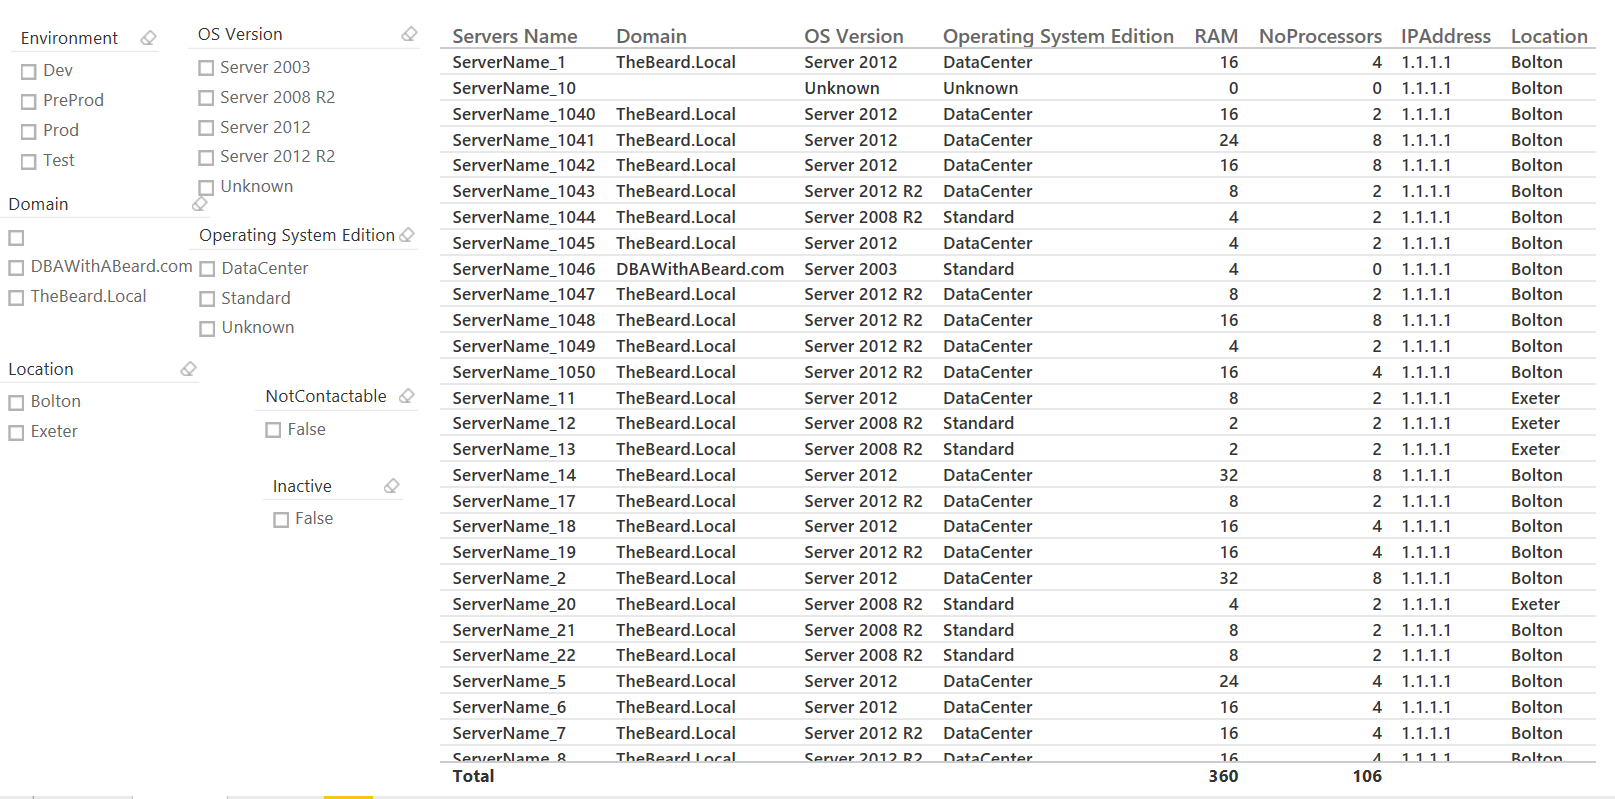
I create a separate page in the report to display all of the server data as this can be useful for other teams such as the systems (server admin) team. I give them a lot of different slicers : - Domain, Location, Environment, OS Version, Edition and NotContactable with a table holding all of the relevant values to enable them to quickly see details
You can get all of the scripts here
I have written further posts about this
Using Power Bi with my DBA Database
Populating My DBA Database for Power Bi with PowerShell – Server Info
Populating My DBA Database for Power Bi with PowerShell – SQL Info
Populating My DBA Database for Power Bi with PowerShell – Databases

