Introduction
If you have ever come back to a script the next morning and thought “what on earth happened last night?”, you understand why logging matters. Write-Host and Write-Verbose are fine for interactive use, but in automation — scheduled tasks, CI/CD pipelines, long-running jobs — you need something more structured. Something you can query, filter, and persist across sessions, something that you can provide to your team or support or auditors.
MicrosoftFabricMgmt uses PSFramework for all its internal logging, and that capability is available directly to you.
How the Module Logs Internally
Every significant action inside MicrosoftFabricMgmt writes a structured log message using Write-PSFMessage. You do not need to configure anything to benefit from this — the messages are written automatically as cmdlets run.
There are many log levels available, but the ones used in the module are Important, Verbose and Debug.
Viewing the In-Memory Log
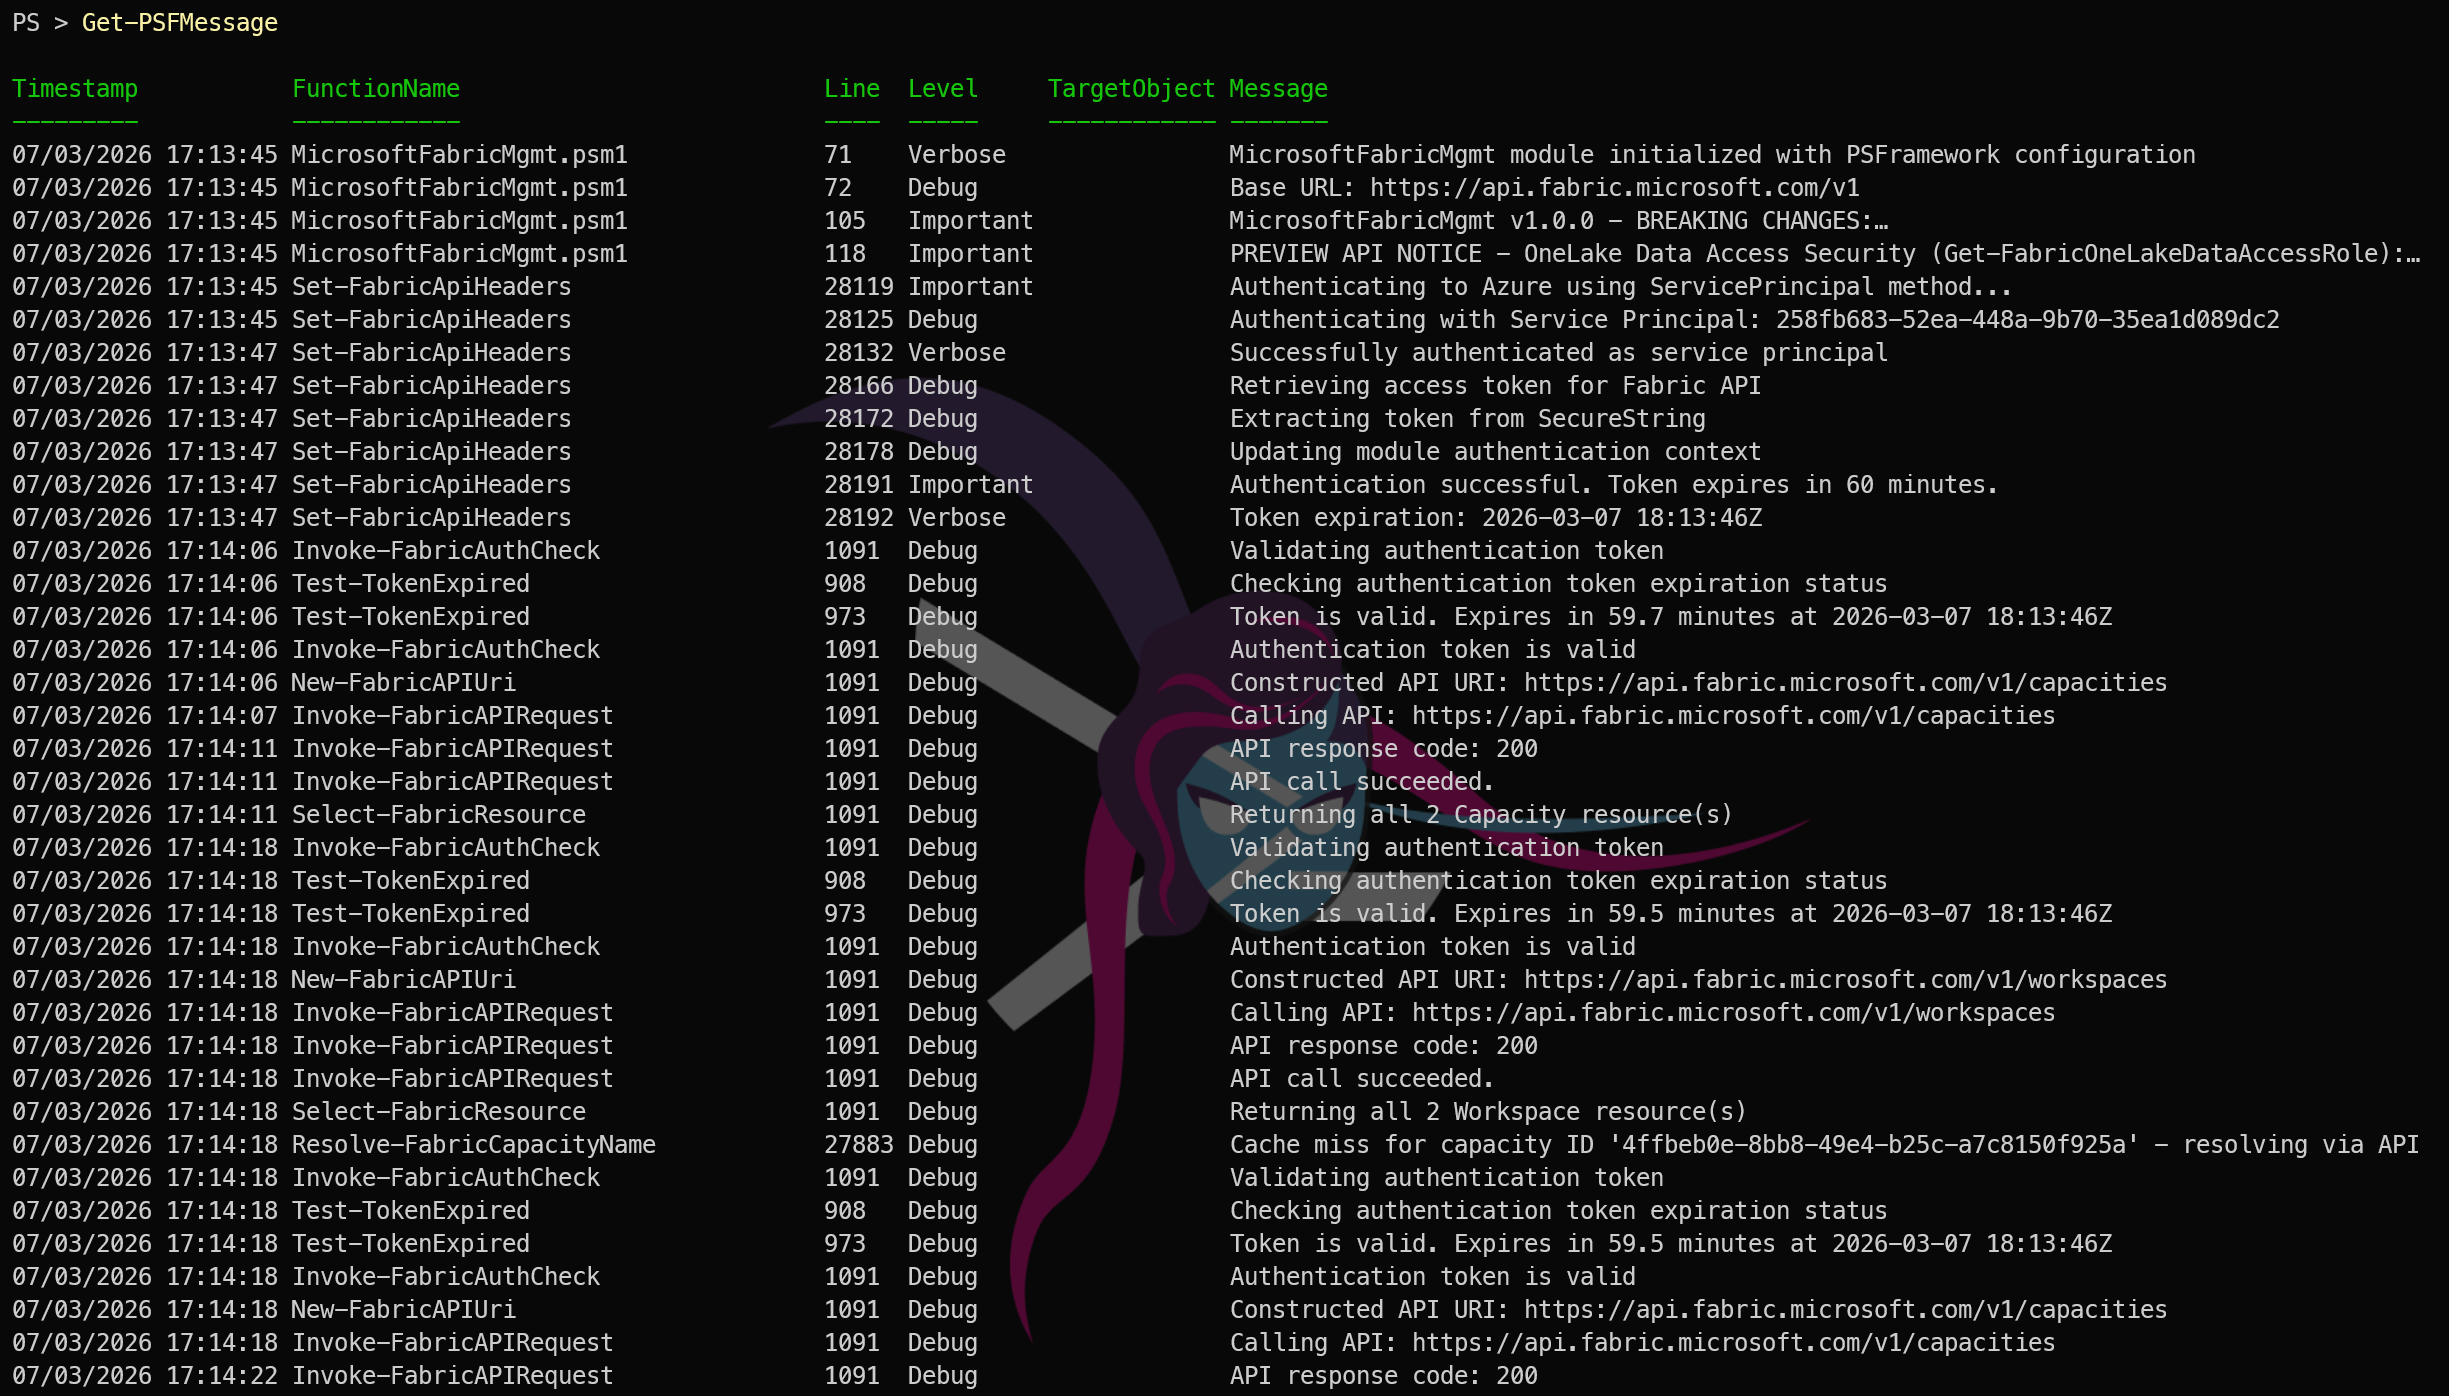
PSFramework keeps a rolling in-memory log of all messages from the current session. Access it with:
| |

This returns all log entries. You can filter by level, function name, or timestamp:
| |
This is invaluable after running a large automation script. Instead of hoping something printed to the console at the right moment, you can inspect exactly what happened.
Default Logging to a file
By default, PSFramework also writes all messages to a log file in the user’s profile directory. You can always find the path with:
| |
This file is a plain text log that you can open with any text editor. It contains all of the same messages that you see from Get-PSFMessage.
Other Logging Destinations
PSFramework supports multiple logging destinations (called “providers”) out of the box, You can list thme and see which are enabled with:
| |
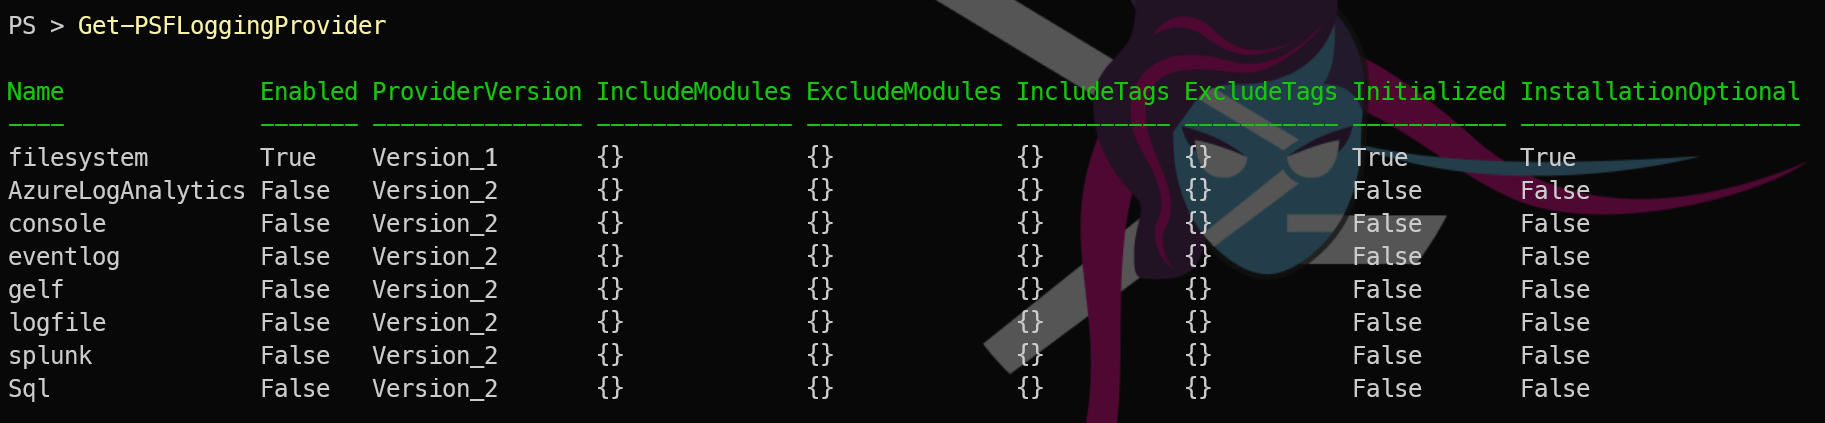
which will show you all the providers available and which are currently enabled.
All the details about logging providers and how to configure them are in the PSFramework documentation, but the key point is that you can easily send your MicrosoftFabricMgmt logs to Azure Log Analytics, Splunk, or any other system you use for log aggregation and analysis even a SQL database if you want.
Tomorrow we look at the other half of resilient automation: error handling and retry logic. What happens when a Fabric API call fails? The module handles a lot of it for you. See you then.