30/11/2018 – Function has been updated to deal with named instances.
Last week the Tiger Team released their Availability Group Failover Detection Utility which will provide root cause analysis on Cluster Logs, SQL Error Logs, and the Availability groups extended events logs. There is a blog post here and the tool can be downloaded from the Tiger Team GitHub Repository
A Bit of Faffing*
It states on the readme for the Tiger Team GitHub Repository.
Repository for Tiger team for “as-is” solutions and tools/scripts that the team publishes.
The important words are “as-is” sometimes these tools need a bit of faffing some looking after!
There is a pre-requisite and sometimes a little “fixing” that you need to do to get it to run correctly.
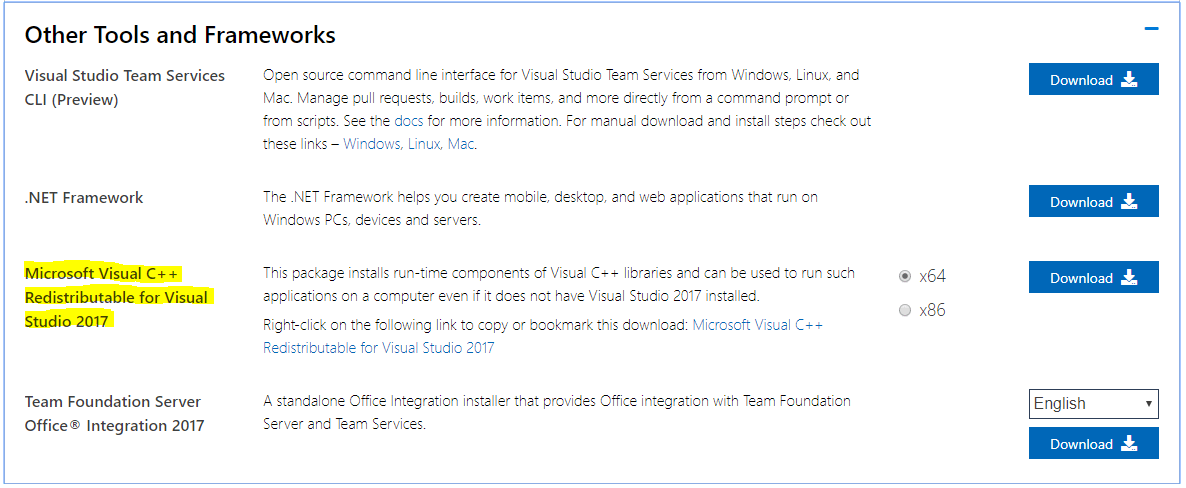
First, install the “Microsoft Visual C++ Redistributable for Visual Studio 2017” from here. On the download page, scroll down to the “Other Tools and Frameworks” section to download the redistributable (x64 version).
Then when you run FailoverDetection.exe you may get strong name validation errors like.
Unhandled Exception: System.IO.FileLoadException: Could not load file or assembly ‘Microsoft.Sq1Server.XEvent.Linq, Version=15.0.0.0, Culture=neutral, PublicKeyToken=89845dcd808cc91’ or one of it s dependencies. Strong name validation failed. (Exception from HRESULT; 0x8013141A) – – – >.Security.SecurityException: Strong name validation failed. (Exception from HRESULT: 0x8e13141A)
—End of inner exception stack trace —
at FailoverDetector. XeventParser.LoadXevent(String xelFi1eName, String serverName)
Then you will need to run the sn.exe tool which is in the zip file. Use this syntax.
.\sn.exe -Vr PATHTODLLFile
I had to do it for two DLLs.
NOTE – If you get an error like this when running sn.exe (or any executable) from PowerShell it means that you have missed the .\ (dot whack) in front of the executable name.
* Faffing – Doing something that is a bit awkward See Link .
Logs required for the Tool
To run the Failover Detection Utility you need to gather the following information from each replica and place it in the specified data folder.
- SQL error logs
- Always On Availability Groups Extended Event Logs
- System Health Extended Event Logs
- System log
- Windows cluster log
Once you have gathered all of that data then you need to alter the configuration file for the executable.
| |
Running The Tool
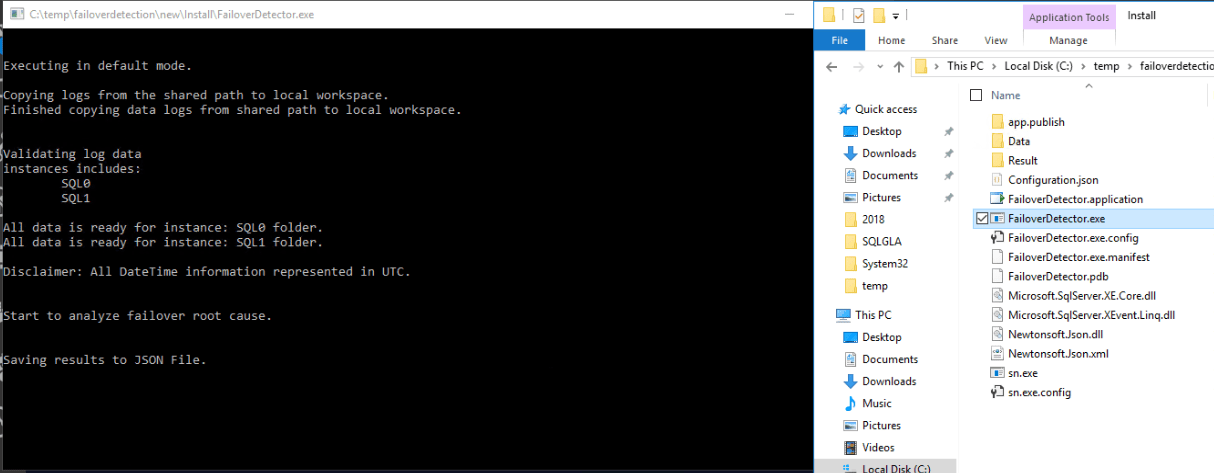
Once you have done that you can then run the Failover Detection Utility. You can double click the exe,
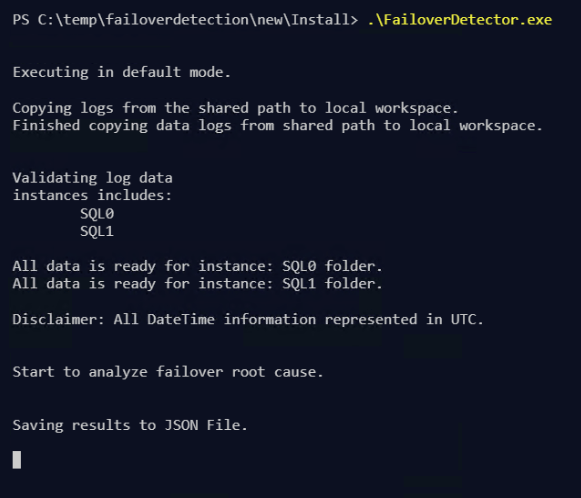
or you can run it from the command line.
In both cases it won’t exit so when you see the Saving Results to JSON file, you can press enter (sometimes twice!).
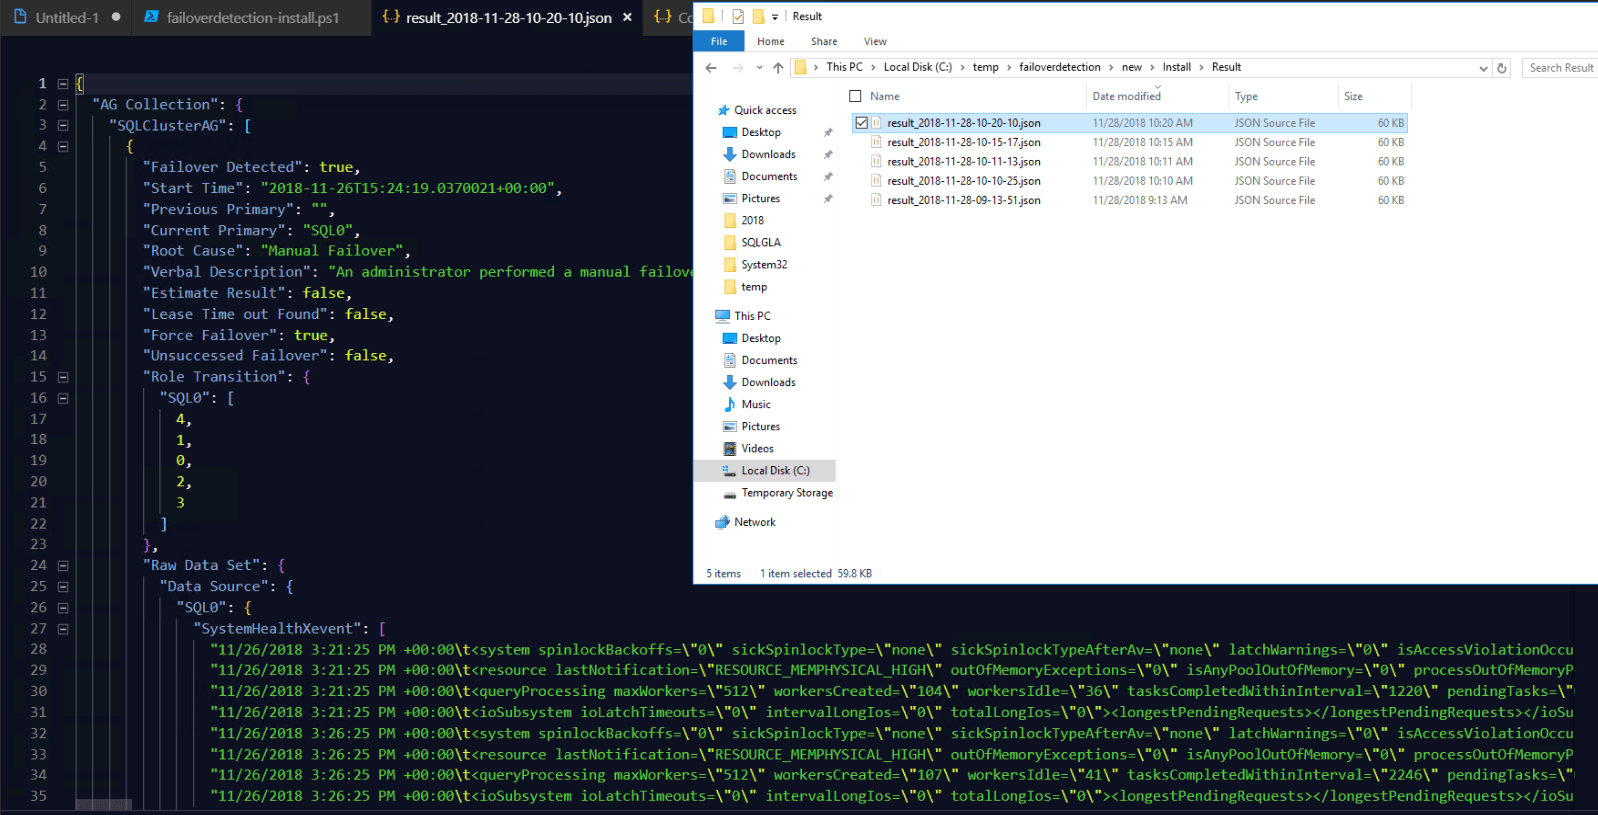
The results can be seen in the JSON file which will be stored in a Results directory in the directory that the the FailoverDetection.exe exists.
You can also use some switches with the FailoverDetection utility.
**–Analyze – **When “–Analyze” is specified as a parameter, the utility will load configuration file without copying log data. It assumes the log files have already been copied over. It does everything as default mode except copying log data. This option is useful if you already have the data in the local tool execution subdirectories and want to rerun the analysis.
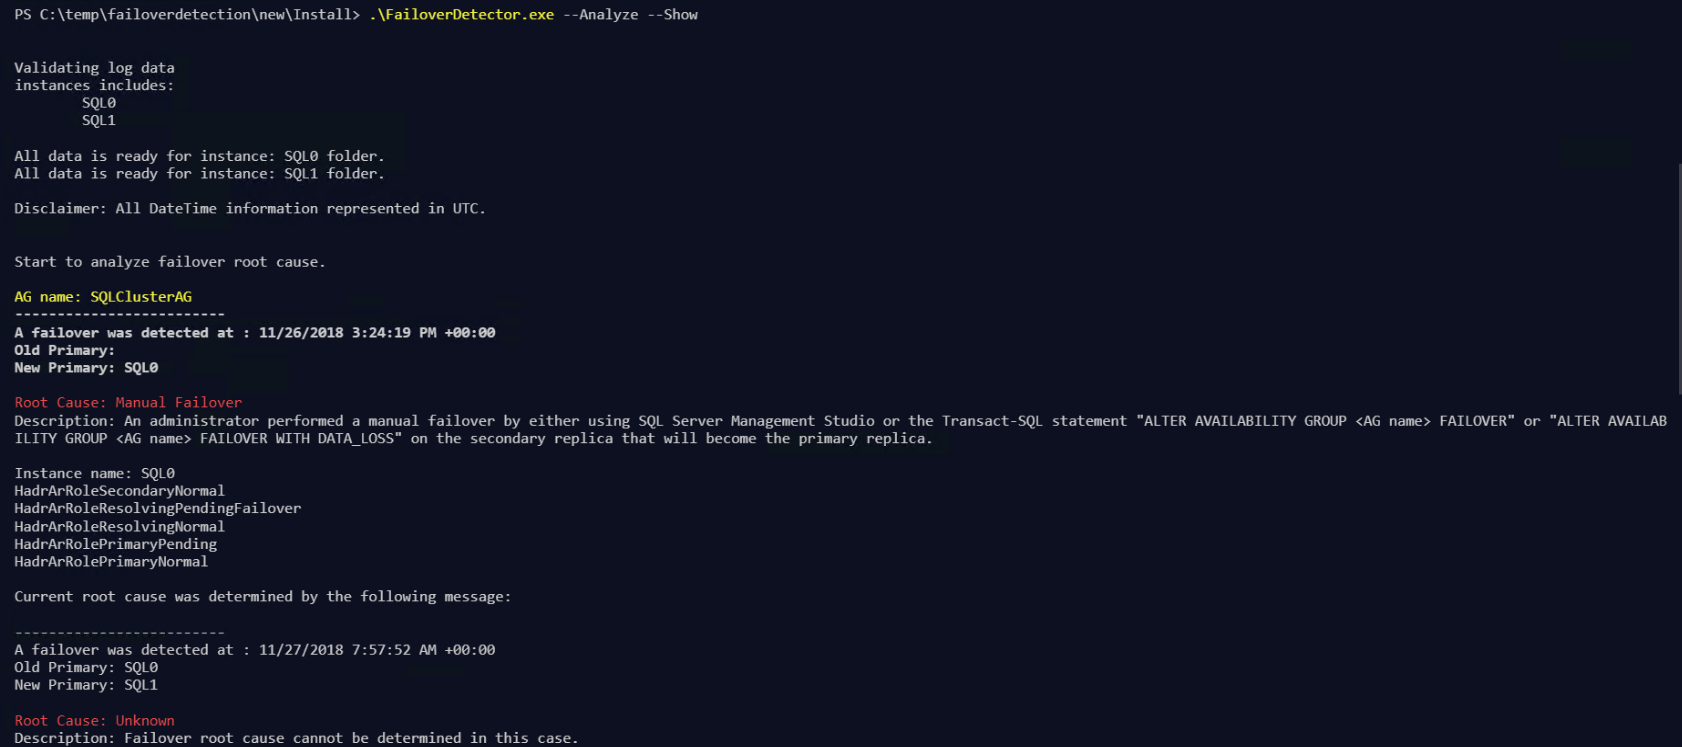
–-Show -The utility after analyzing log data will display the results in the command console. Additionally, the results will be persisted to a JSON file in the results folder.
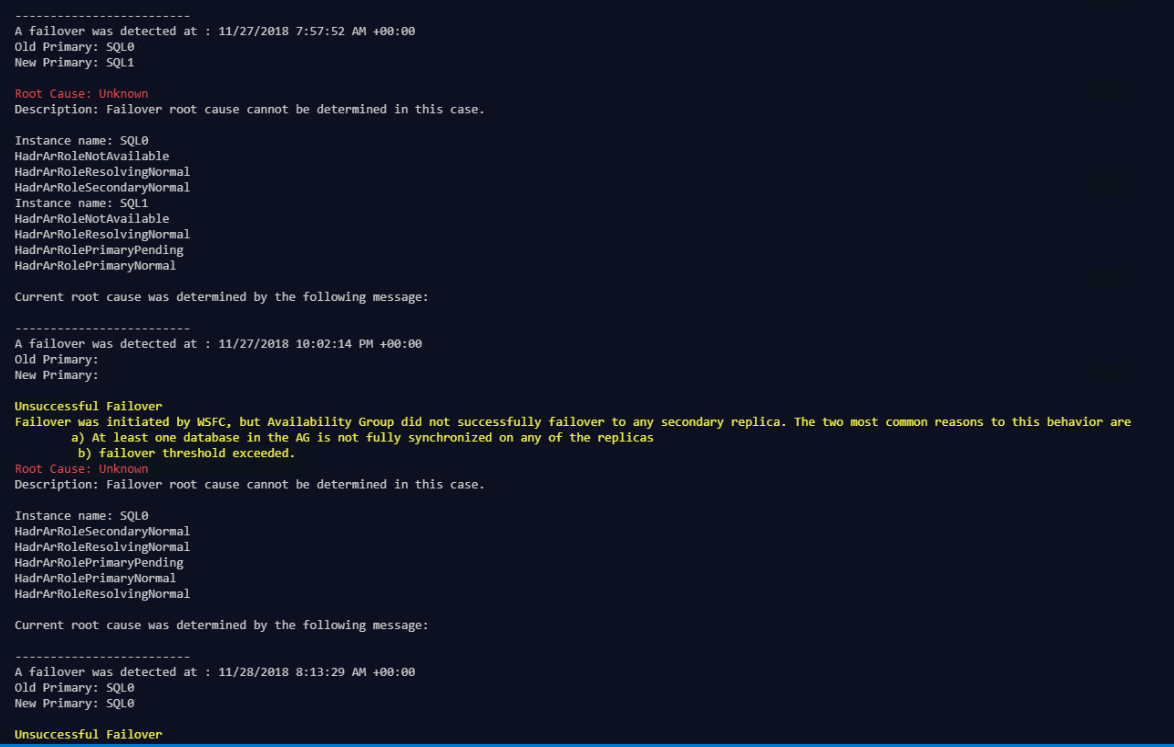
They look like this
Again, you need to press enter for the details to come through. The results are still saved to the Results folder as json as well so you won’t lose them.
When You Are Doing Something More Than Once ….
Automate it 🙂
When I saw the data that needed to be gathered for this tool, I quickly turned to PowerShell to enable me to easily gather the information. That has turned into a function which will
- Download and extract the zip file from the Tiger Team GitHub repository
- Identify all of the replicas for an Availability Group and dynamically create the configuration JSON file
- Gather all of the required log files and place them in a specified data folder
- Run the FailoverDetection.exe with any of the switches
- Includes -Verbose, -Confirm, -Whatif switches so that you can easily see what is happening, be prompted to confirm before actions or see what would happen if you ran the function
- You still need to press enter at the end though 🙁
- and you will still need to install the “Microsoft Visual C++ Redistributable for Visual Studio 2017” and runt he strong names tool if needed
This function requires PowerShell version 5, the failovercluster module and and the dbatools module.
You can get the function from my GitHub Functions Repository here (at the moment – will be adding to dbatools see below)
Load the function by either running the code or if you have it saved as a file dot-sourcing it.
. .\Invoke-SqlFailOverDetection.ps1
There are two .’s with a space in between and then a \ without a space. so Dot Space Dot Whack path to file.
The next thing you should do is what you should always do with a new PowerShell function, look at the help.
Get-Help Invoke-SqlFailOverDetection -Detailed
You will find plenty of examples to get you going and explanations of all of the parameters.
Let’s see it in action.
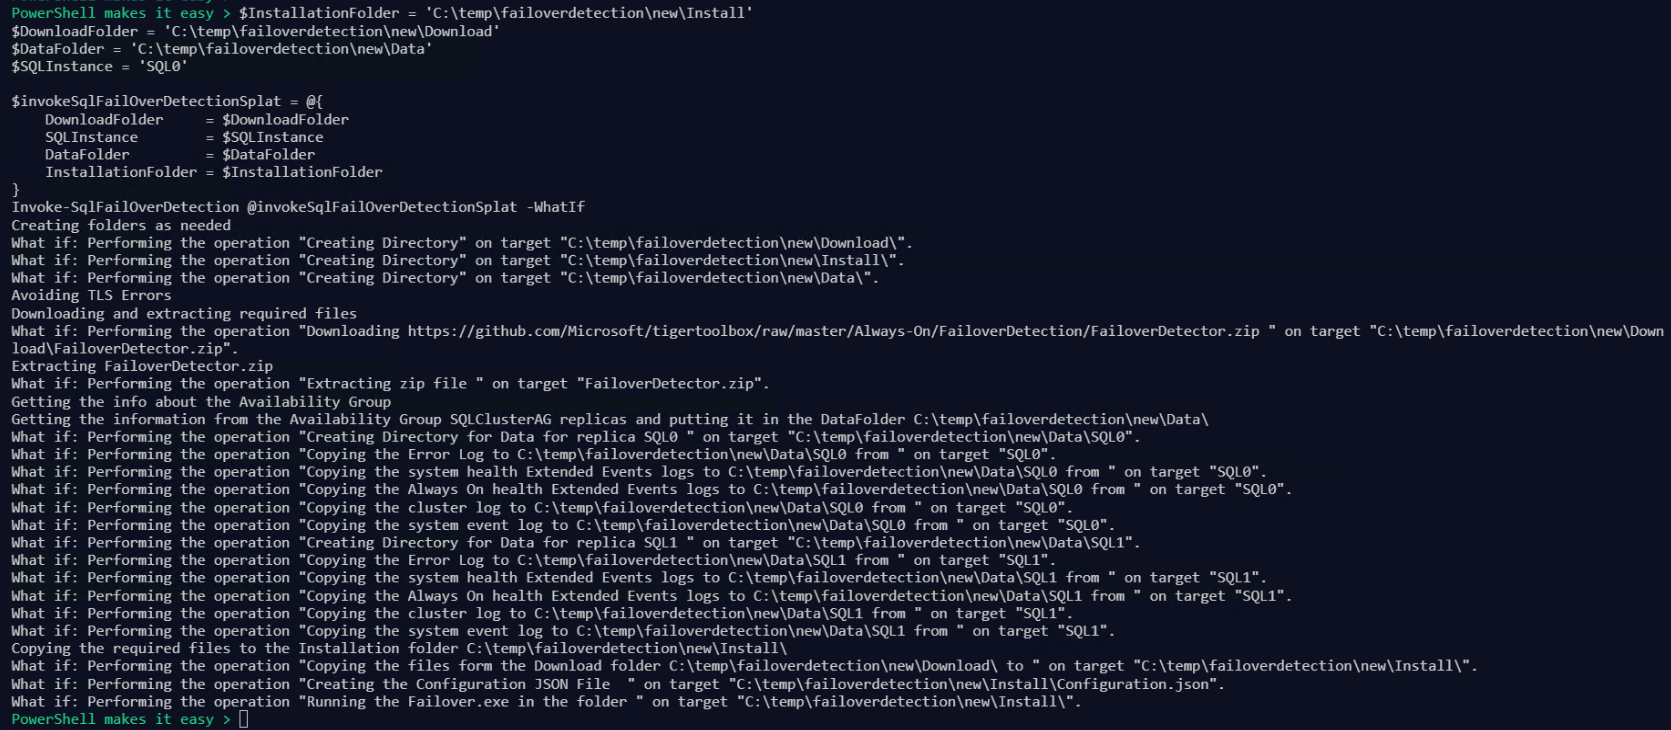
First lets run with a -WhatIf switch which will show us what will happen without performing any state changing actions.
| |
So you can see that if we run it without the -WhatIf switch it will
- Create some directories
- Download the zip file from the repo
- Extract the zip file
- Copy the required logs from each of the replicas to the data folder
- Create the JSON configuration file
- Run the executable
NOTE : – I have limited the gathering of the system event log to the last 2 days to limit the amount of time spent dealing with a large system log. I gather all of the SQL Error logs in the Error log path as that works for the first scenario I wrote this for, your mileage may vary.
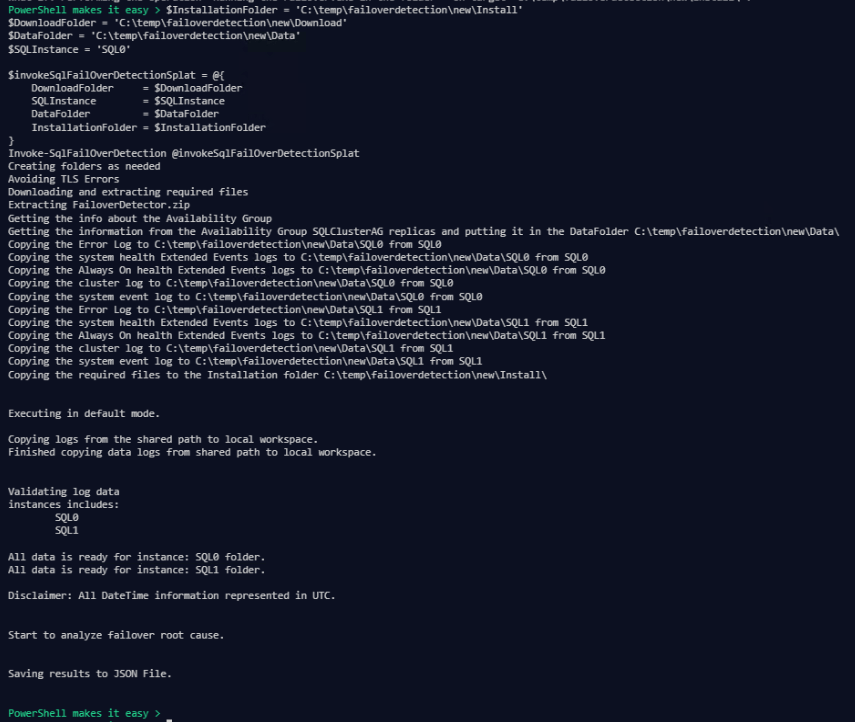
So if we want to run the command we can remove the -WhatIf switch.
| |
It can take a little while to run depending on the number of replicas, size of logs etc but once it has started running you can do other things.
It will require being run as an account with permissions to all of the folders specified and Windows and SQL permissions on all of the replicas in the Availability Group.
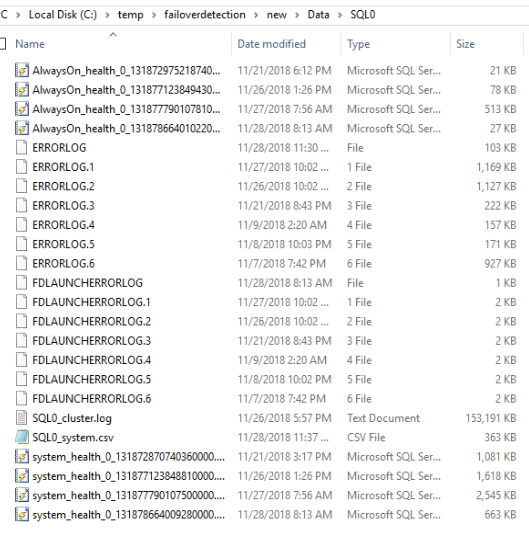
As you can see below it has gathered all of the results and placed them in the data folder.
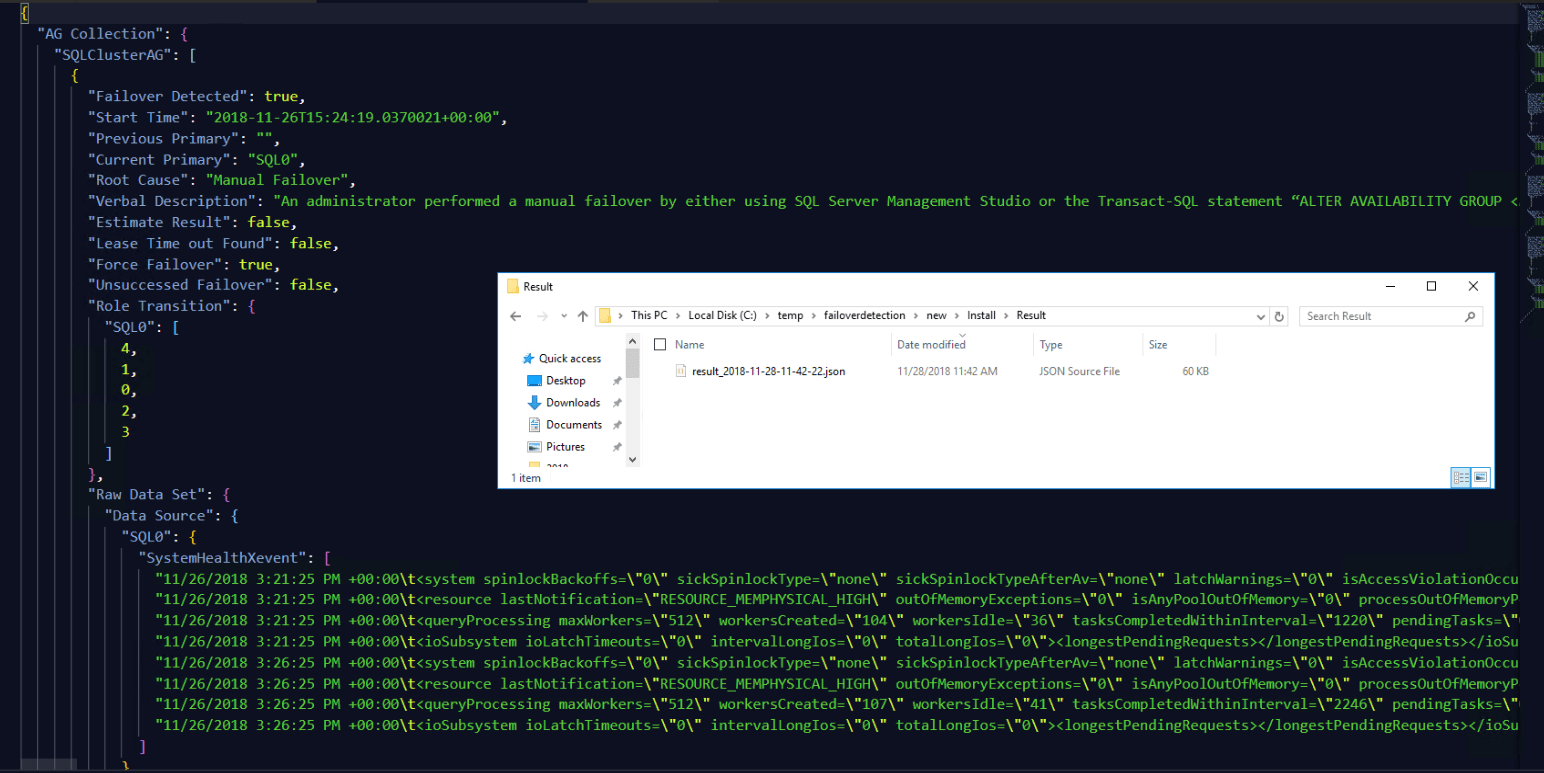
The results can be found in the results folder.
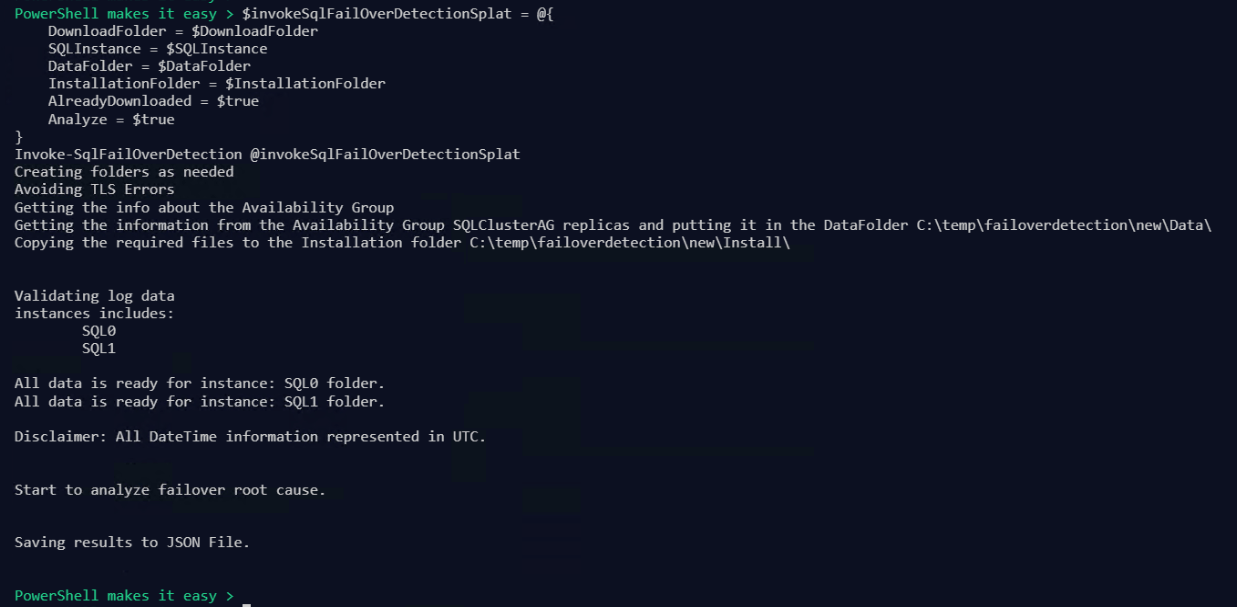
If I have already run the tool, I can use the Analyze switch to save gathering the data again. I also use the AlreadyDownloaded switch as I do not need to download the zip file again.
| |
and the results are again saved in the results folder.
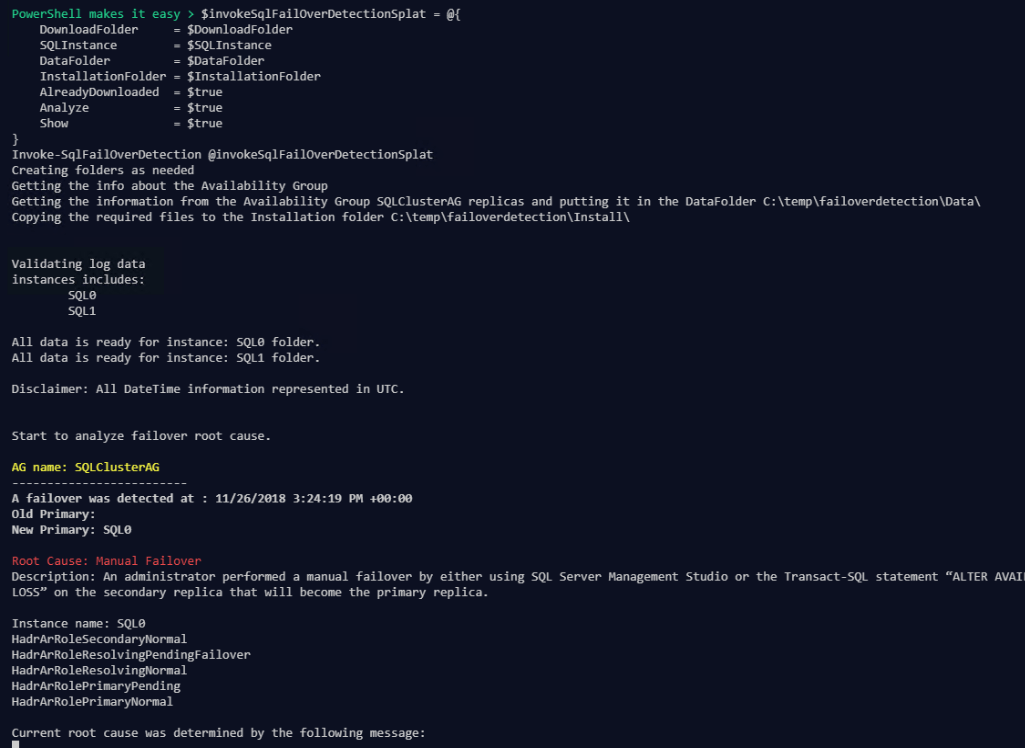
I can show the results on the screen as well as saving them as JSON with the Show parameter.
| |
You will then need to press enter to get the next lot of results.
Why Not Add This To dbatools?
I haven’t added this to dbatools (yet) because I wrote it in this way for a particular need and dbatools requires support for PowerShell V3 . I have, however created an issue added to this issue in the dbatools GitHub Repository (as this is how you to start the process of adding things to dbatools) so hopefully we can get it in there soon as well – in which case I will come back and update this post.
Happy Automating!


