Introduction
Yesterday I introduced fabric-toolbox — Microsoft’s community-driven repository of Fabric accelerators. Today we look at one of its flagship solutions: FUAM, the Fabric Unified Admin Monitoring solution.
When you are responsible for a Microsoft Fabric tenant, it will not be very long before you are facing many questions.
Questions like:
- How is my capacity being used?
- Which workspaces are consuming the most resources?
- What are my users actually doing?
- When are my peak usage times?
You can scabble around in the Admin portal and try to piece together the answers, but it is a bit like trying to navigate a city with a paper map — you can get there eventually, but it is slow and painful, and you will probably miss some things along the way.
What Is FUAM?
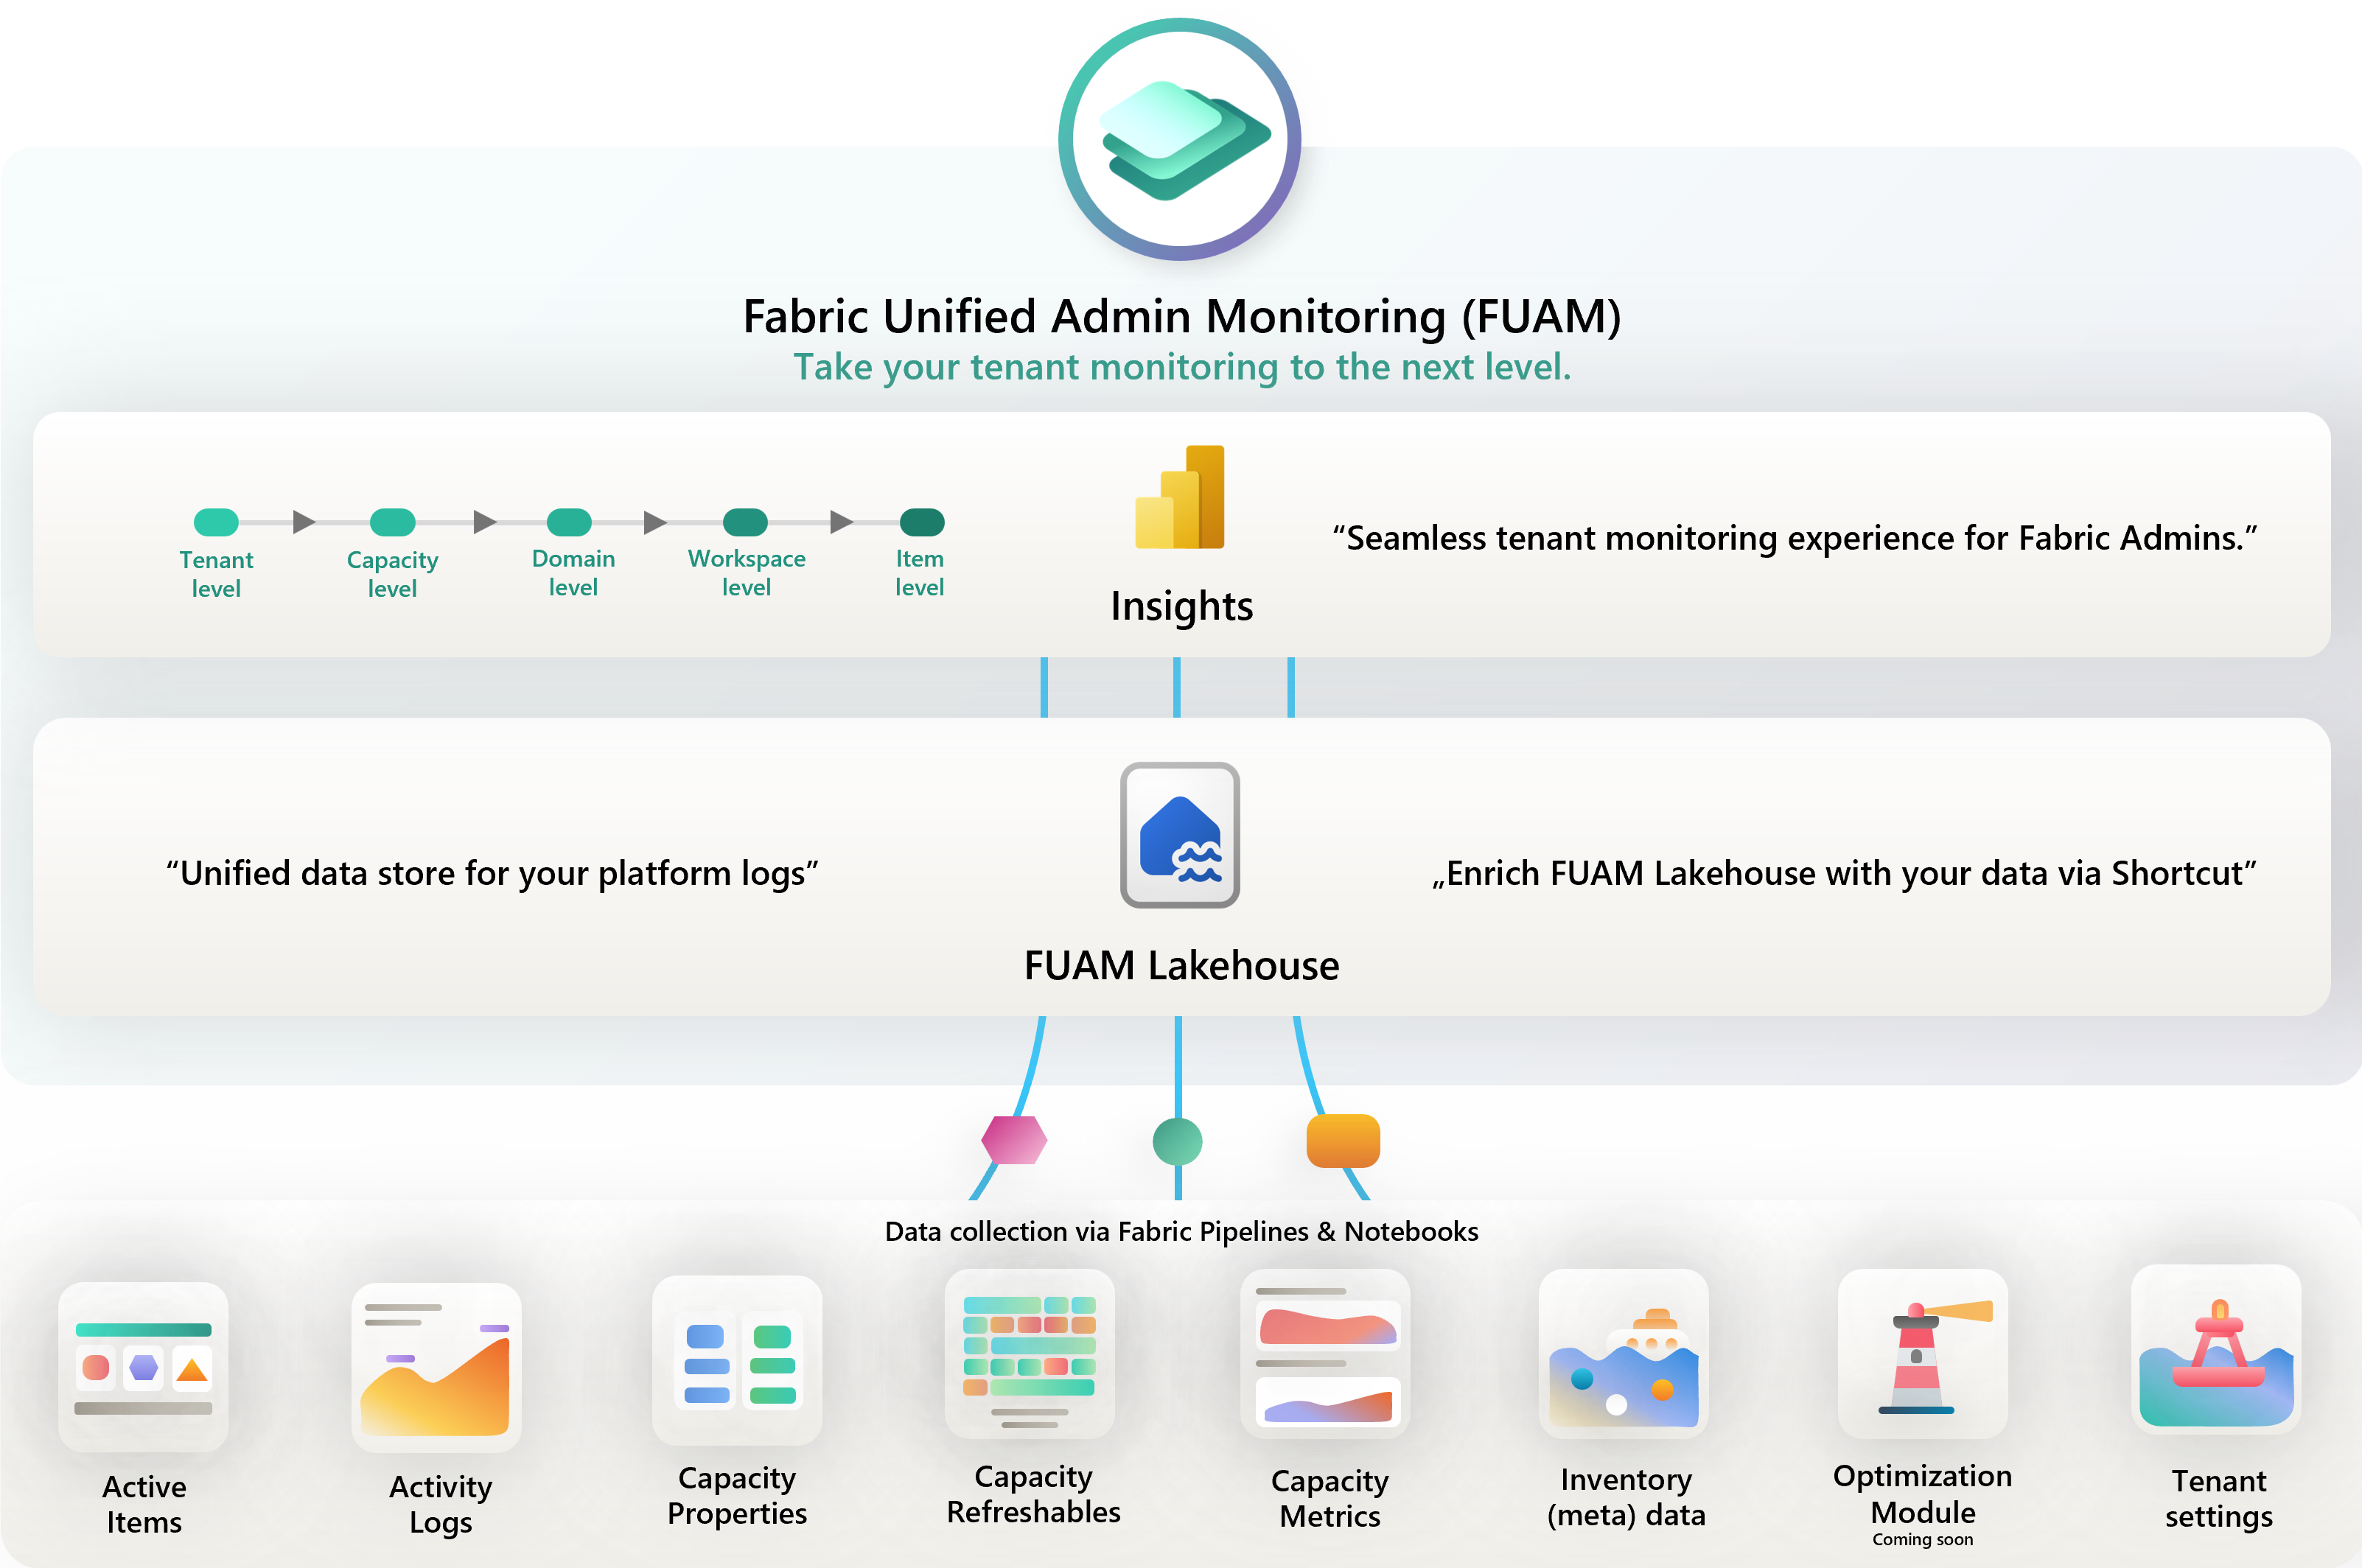
FUAM is a monitoring solution for Microsoft Fabric administrators. It gives you a holistic, near real-time view of your Fabric platform depending on how frequently you schedule the data collection notebooks to run. It is designed to be a one-stop-shop for all your monitoring needs, providing insights into capacity utilisation, workspace inventory, user activity, and overall health of your Fabric tenant.
Using FUAM I am able to answer all of those questions and more, and provide folk with 3 bazillion* reports and dashboards to explore the data themselves. (*Number may be slightly exaggerated but you get the idea)
It is all built using Fabric’s own native capabilities so can also learn about how to use those capabilities by looking at how FUAM is built. The code is all open source and well documented, so you can see exactly how it works and even contribute if you want to.

Where to Find It
FUAM lives in the fabric-toolbox repository at github.com/microsoft/fabric-toolbox/tree/main/monitoring/fabric-unified-admin-monitoring.
The README is comprehensive and walks you through the prerequisites, deployment steps, and what each dashboard component shows.
What You Get
Once deployed, FUAM provides dashboards covering a range of monitoring aspects.
No deletion of data older than 14 days like the Capacity Metrics App. This is more useful than you might think, because it allows you to do things like correlate CU consumption with specific reports or activities that you know happened at a certain time, and it allows you to build up a picture of usage patterns over time.
FUAM extracts the following data from the tenant:
- Tenant Settings
- Delegated Tenant Settings
- Activities
- Workspaces
- Capacities
- Capacity Metrics
- Tenant meta data (Scanner API)
- Capacity Refreshables
- Git Connections
Full list of the reports are here
How It Works
FUAM collects data using the Fabric REST APIs and the Microsoft 365 audit log, ingests it into a Lakehouse, and transforms it using PySpark notebooks. Power BI reports connect to the Lakehouse’s SQL endpoint to provide the dashboards. Simples yeah ? :-) (When somebody else has built it for you!)
Deployment Overview
Deployment involves:
- Creating a dedicated workspace for FUAM in your Fabric tenant
- Running the setup notebook from the repository, which creates the Lakehouse, tables, semantic models, and reports
- Configuring authentication (FUAM uses a Service Principal to call the Fabric Admin APIs)
- Scheduling the data collection notebooks using Fabric’s built-in job scheduler
The full step-by-step is in the FUAM README. The SPN permissions are the step that tends to catch people out — make sure you follow those carefully.
Best of all
You can use it to save time, energy and CUs by using it to feed many other solutions that you may build over time.
For example, last week I used it to identify the details of over 40 thousand reports and semantic models to gather information about the RLS on them and I could do it without overloading the Admin API because FUAM had already gathered the data.
You can also build queries on top of the FUAM Lakehouse to enable other teams to help themselves to the data they need without having to give them direct access to the Admin API or run their own data collection.
Trying to build your own Fabric monitoring solutions from scratch is a significant amount of work — API pagination, schema management, Power BI data modelling, refresh scheduling. FUAM does all of that for you, and it is maintained by the CAT team and the community, so it improves over time.
If you are managing a Fabric tenant of any real size, FUAM is worth the deployment effort. A few hours of setup buys you ongoing visibility that would otherwise take weeks to build yourself.
Tomorrow
Tomorrow we look at FCA — Fabric Cost Analysis — which takes a FinOps approach to understanding what your Fabric capacity is actually costing you. See you then.