Introduction
As the year draws to a close, it’s a time for reflection and setting new goals. It’s also a time to over consume calories!
For the last few years in our house we (My wife Traci (S) (L) and I) have been participating in the Festive 500, a cycling challenge that encourages riders to cover 500 kilometers between Christmas Eve and New Year’s Eve.
There are a couple of reasons that we enjoy this challenge so much. It helps to counterbalance the indulgent eating and drinking that often accompanies the holiday season. (As Jess Pomfret (B) (S) (L) and I often say, we exercise so that we can eat more nice food.) It provides a fun and motivating way to stay active during a time of year when it’s easy to become sedentary. Finally, it is a challenge that we can do together, that requires some planning and organising and provides a great sense of achievement.
This is a tech blog Rob!
Yup, I hear you. So why am I mentioning this here?
You can learn a lot about the technology that you work with by creating solutions and solving problems for personal projects and hobbies, just like you do at work.
The Festive 500 provides an excellent opportunity to do just that. By tracking our cycling data throughout the challenge, I can create a dashboard that not only helps us to monitor our progress but also to learn and explore things that I dont often get to do in my day job.
Learning through Hobbies
The advantages of using personal projects and hobbies to learn new skills and technologies in this way are many and varied.
For me, it is much easier to understand things when I am actually creating something and using it to solve real problems, rather than just reading about it or watching tutorials. This hands-on approach helps to solidify my understanding and makes the learning process more engaging and enjoyable.
Mostly, as I am doing this is for fun, there is much less pressure to deliver something perfect and usually there is no time pressure either. It gives me the freedom to experiment and explore without the constraints often found in work projects. I delete it and restart if I want to, or try something completely different.
This also means that I am very aware of backup and recovery :-) I use a ProxMox cluster at home to run my homelab, and I make sure that I have regular backups of all of my LXC’s and VMs.
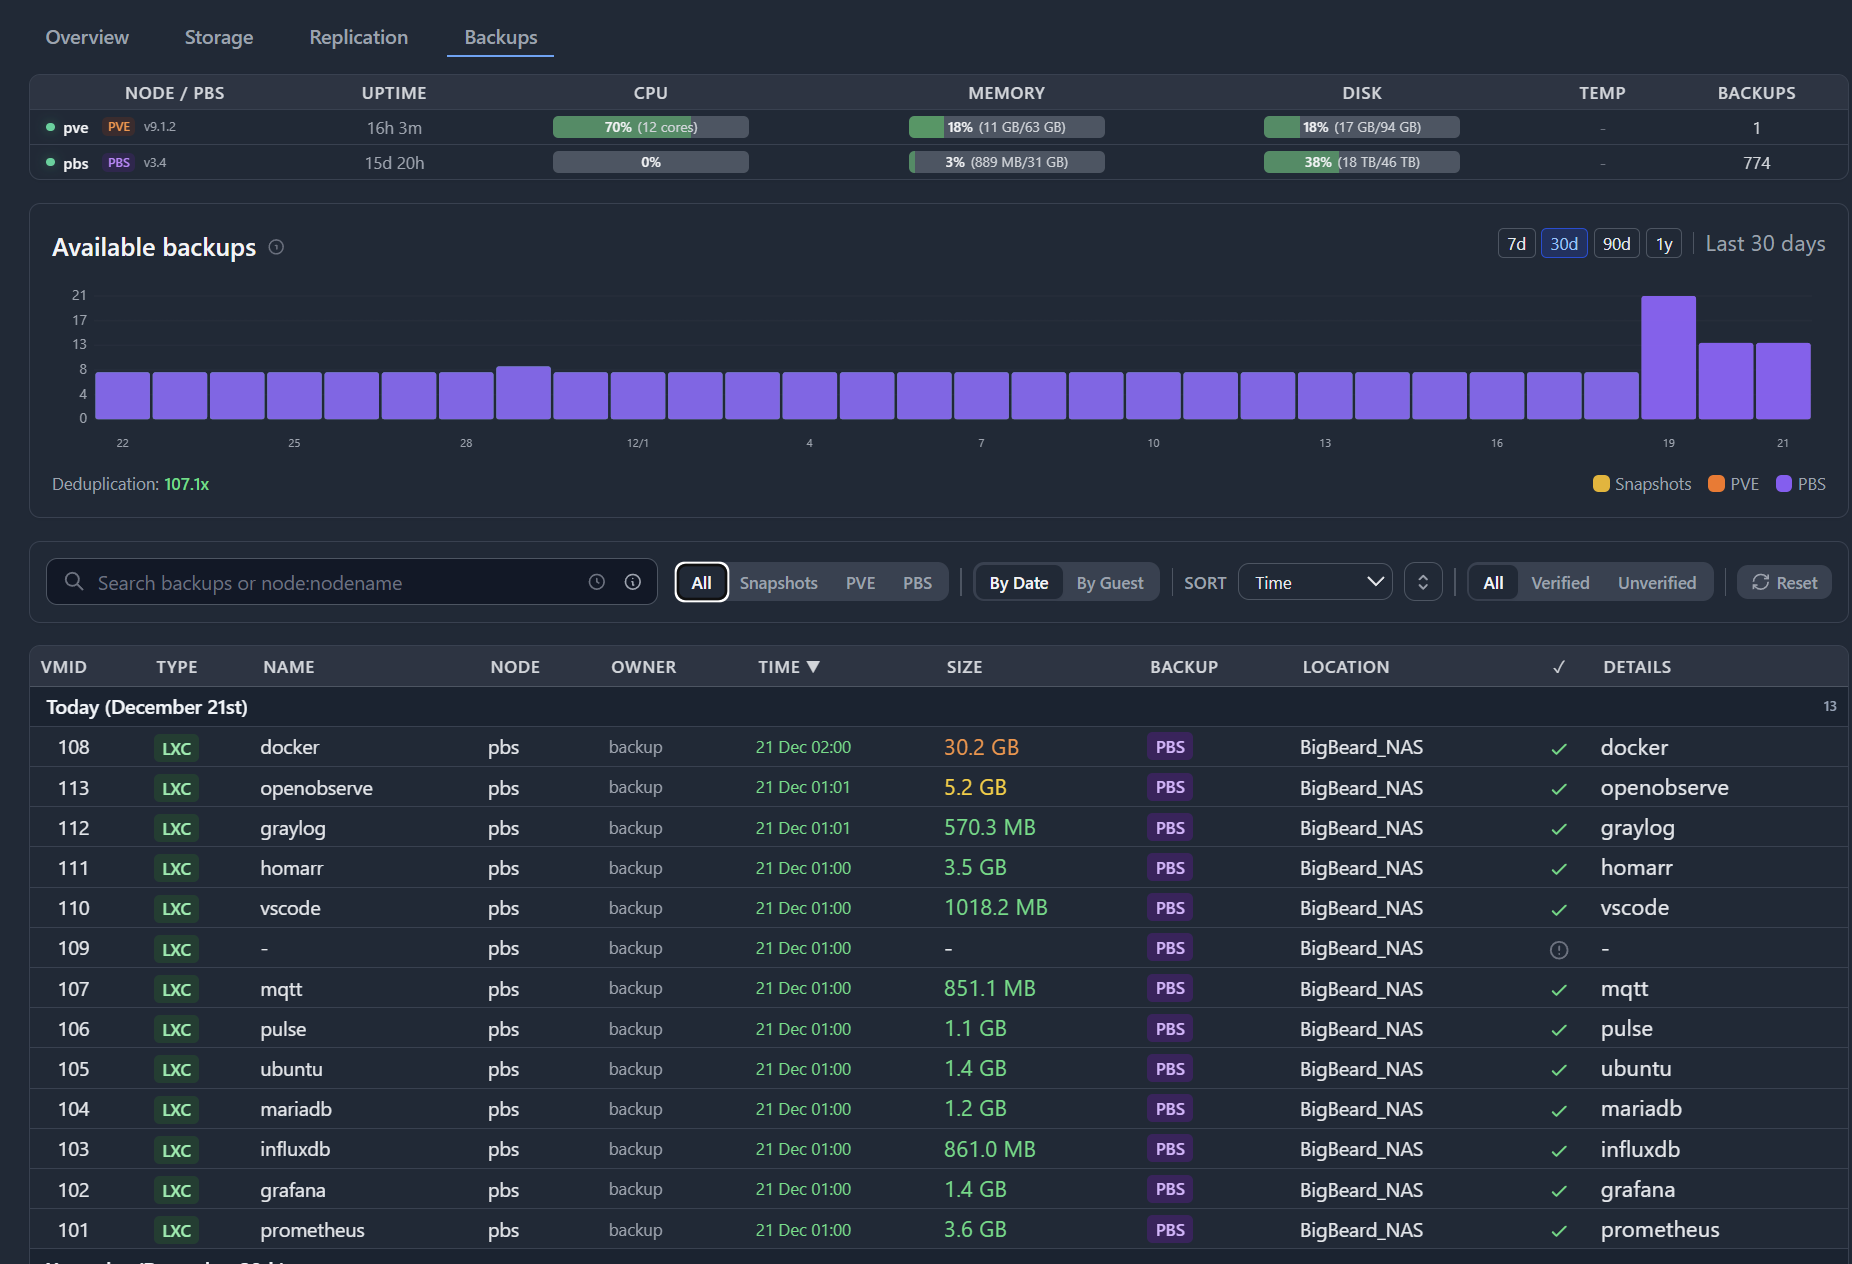
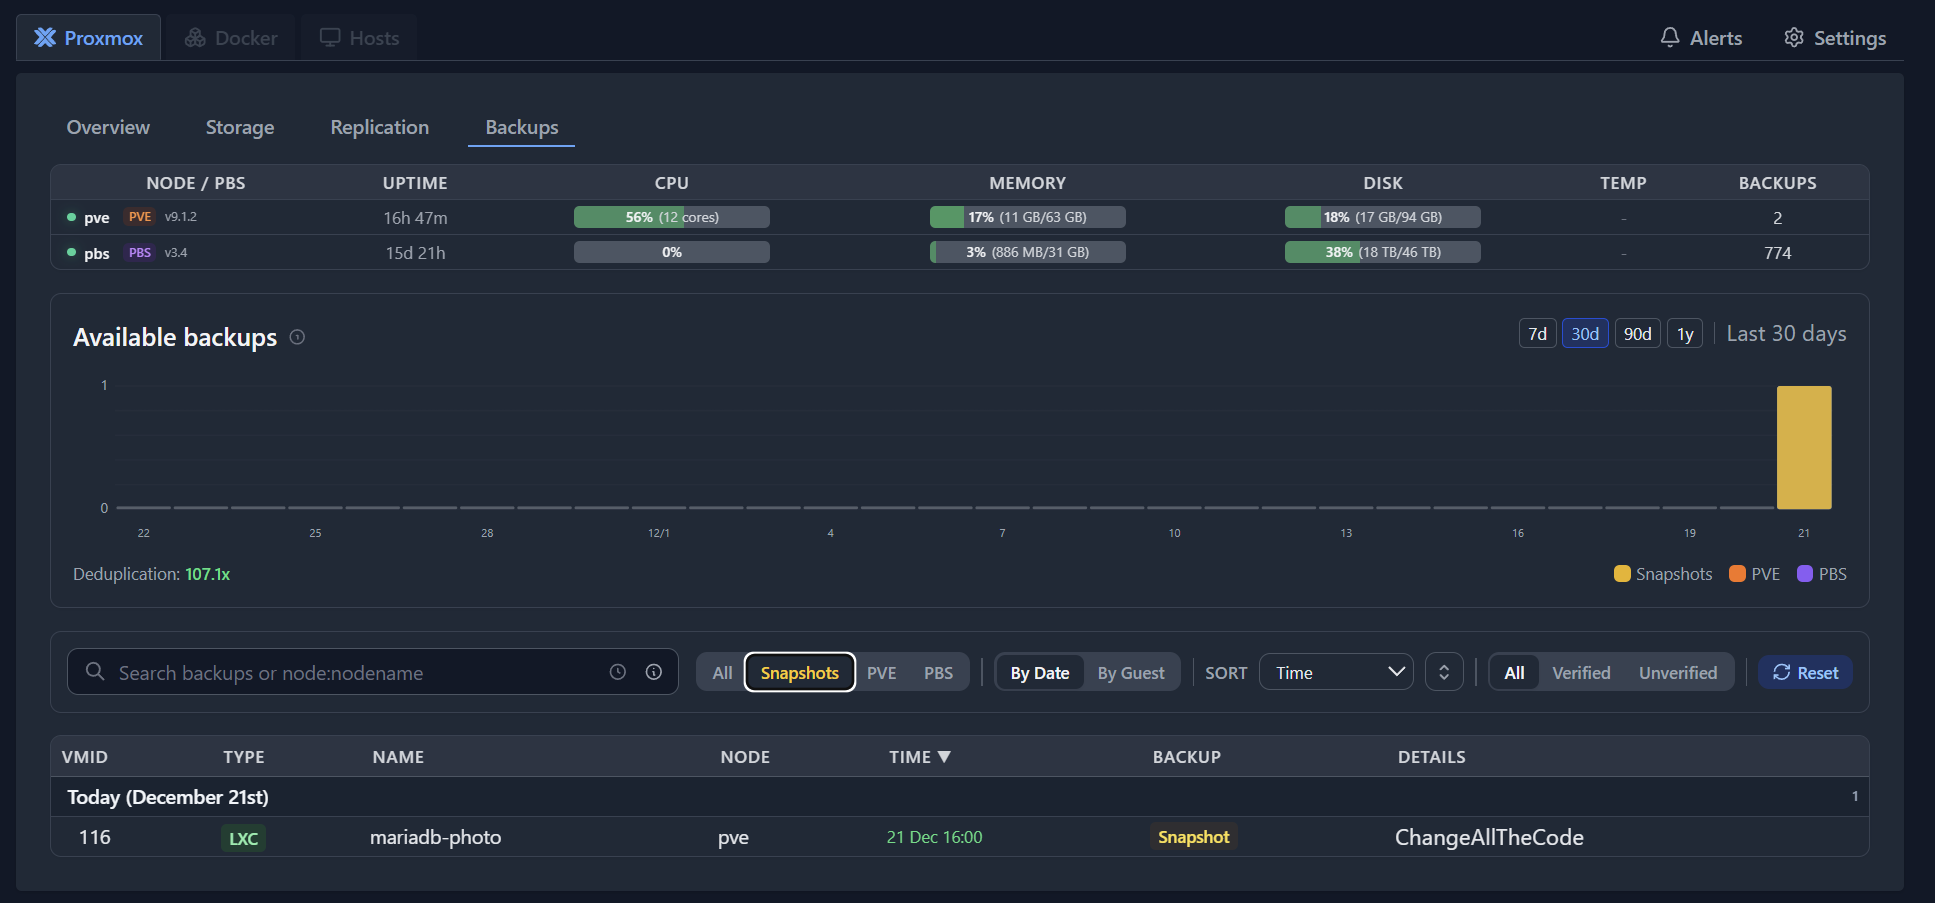
I make use of the snapshot capabilities of ProxMox to take snapshots before making any major changes or updates to my systems. This way, if something goes wrong, I can easily revert back to a previous state without losing any data.
I am a heavy user of Git for version control, even for my personal projects. I use GitHub to host my repositories and make sure to commit my changes regularly. This way, I can track my progress and easily revert back to previous versions if needed.
Finally, working on something that I am passionate about increases my motivation and engagement. I am more likely to stick with it and see it through to completion, which helps me to learn and retain new information. By combining my love of cycling with my passion for technology, I can create a project that is both enjoyable and educational.
I also learn about the human side of creating something for my tech-adjacent wife to use :-) I have to think about usability, accessibility, and how to present the data in a way that is meaningful and useful to her.
The Dashboard
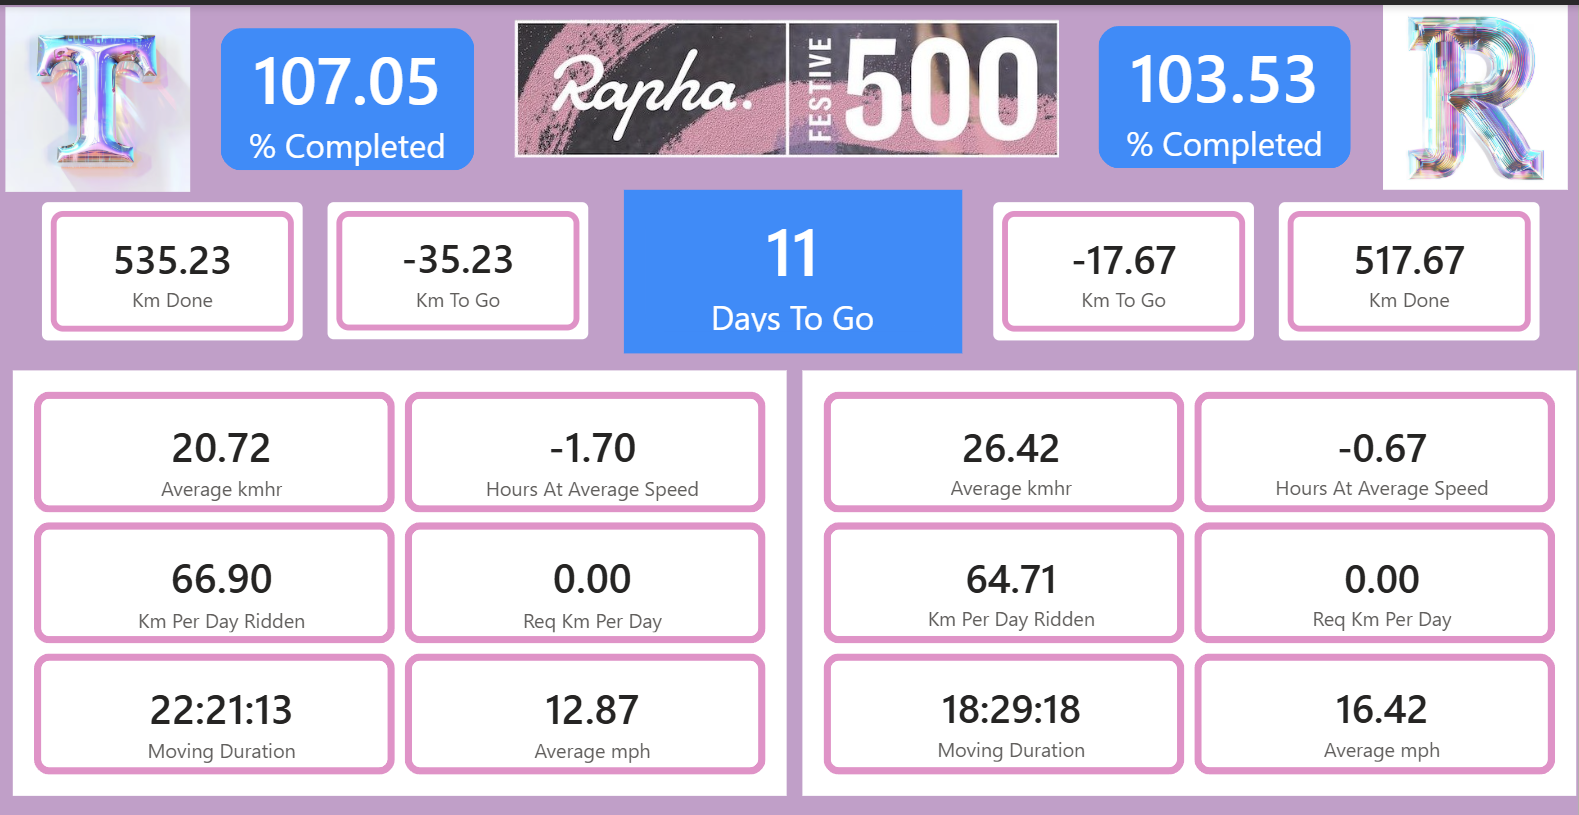
To track our progress in the Festive 500, I created a dashboard using Microsoft Fabric. The dashboard pulls in data from Strava and displays it in a visually appealing and easy-to-understand format. (This has last years data so that we could see what it looked like :-) )

The dashboard includes several key features:
- Progress Tracking: A visual representation of our progress towards the 500-kilometer goal, including distance covered, remaining distance, and average speed.
- Number of Days Left: A countdown of the number of days remaining in the challenge, helping us to stay motivated and on track.
- Hours at Average Speed: A calculation of the total hours required to complete the challenge at our average speed, helping us to plan our rides accordingly.
- Km required per day: A breakdown of the kilometers needed each day to reach the goal, providing a clear daily target.
There is also a Mobile view so that Traci (and I) can check our progress on the go.
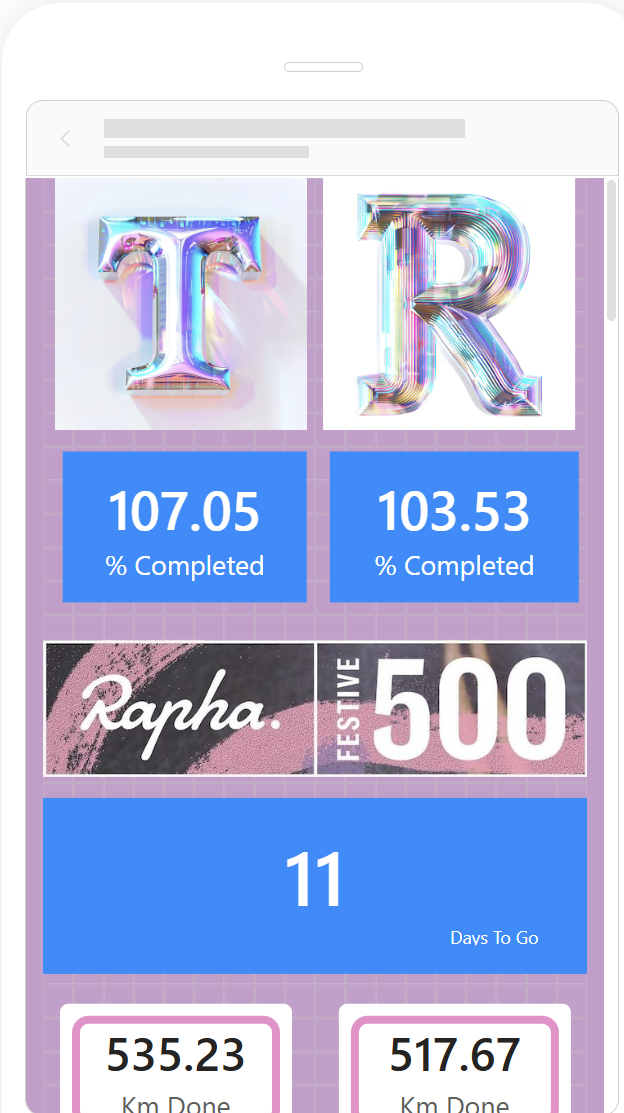
The Fabric Components
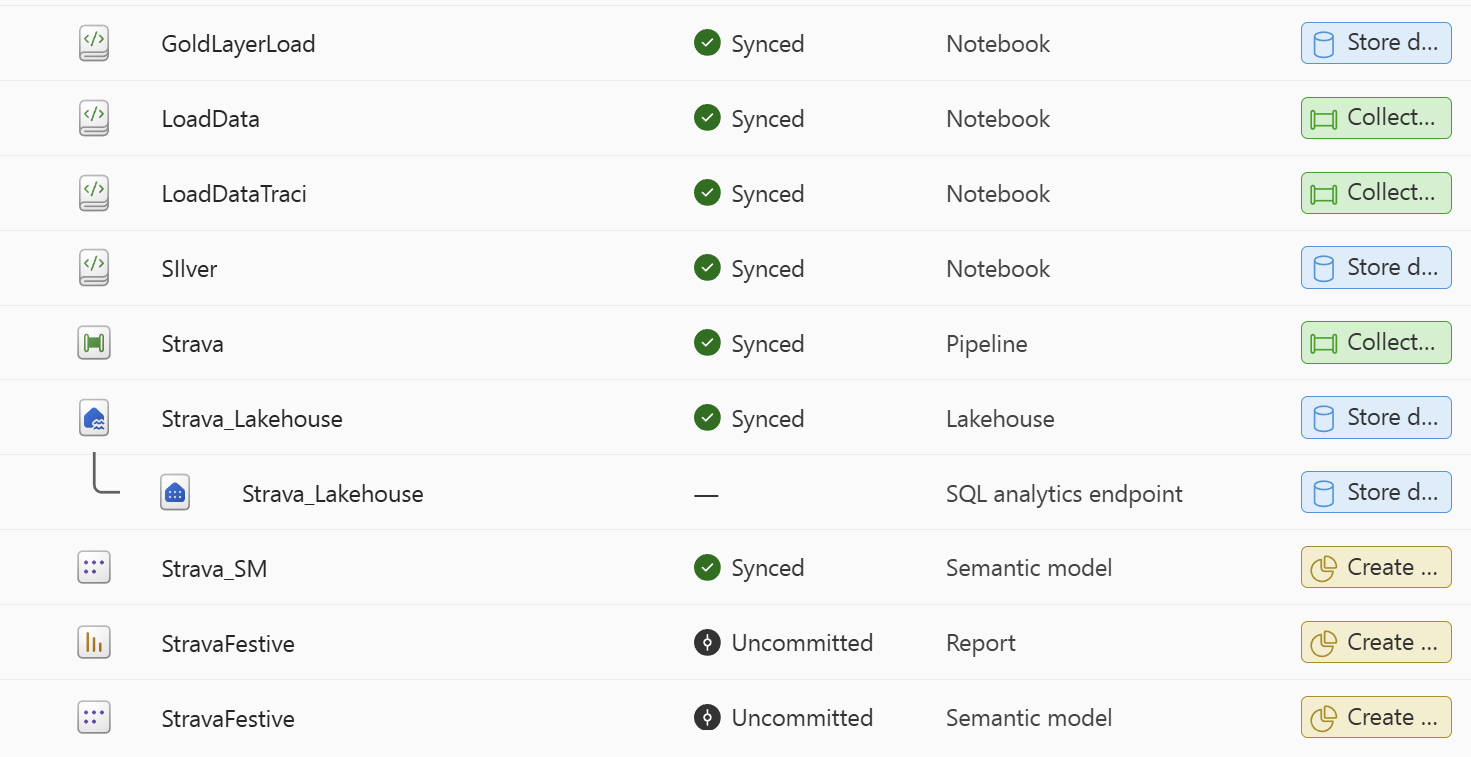
I am not going to go into detail on how I built the dashboard here, as that would make this post far too long.
But here is a screen shot of my Fabric workspace.
Happy Holidays!
I hope that this post has inspired you to consider using your hobbies and personal projects as a way to learn new skills and technologies. Whether it’s cycling, cooking, or any other interest, there are always opportunities to create something meaningful and educational.