Introduction
This week we have been looking at the fabric-toolbox ecosystem. It is full of fantastic tools for folk that use Microsoft Fabric, and I have been doing a deep dive into the monitoring solutions in particular.
Yesterday we covered FUAM — the operational monitoring solution.
Today we look at another monitoring tool in the collection: FCA, the Fabric Cost Analysis solution.
Where FUAM answers “how is my Fabric capacity being used?”, FCA answers “what is it costing us, and who is spending what?”
What Is FCA?
FCA is a FinOps solution for Microsoft Fabric. It brings cost data from Azure Cost Management into Fabric and breaks it down in ways that are meaningful for Fabric administrators and business stakeholders:
- Cost by Fabric capacity
- Cost by workspace
- Cost by SKU and billing meter
- Cost trends over time
- Showback and chargeback breakdowns
The “FinOps” framing is intentional. FCA is designed around the FinOps framework’s principle of making cloud costs visible and understandable to the teams that generate them — not just the finance department.
This free solution was developed in France by several passionate CSA experts in FinOps and Data: Cedric Dupui, Manel Omani, Antoine Richet, and led by Romain Casteres inspired by his Blog article FinOps for Microsoft Fabric.

Where to Find It
FCA lives at github.com/microsoft/fabric-toolbox/tree/main/monitoring/fabric-cost-analysis.
As with FUAM, the README is the place to start.
The FOCUS Standard
FCA doesnt reinvent the wheel, it uses cost data in the FOCUS format — the Flexible Open Cost and Usage Specification. FOCUS is an emerging open standard for cloud cost data, backed by the FinOps Foundation and increasingly supported by major cloud providers including Microsoft.
Azure Cost Management can export cost data in FOCUS format, and this is how FCA is built to consume it. The practical benefit is that FOCUS normalises cost data in a consistent way that makes analysis easier — categories, meters, and service names are standardised rather than being provider-specific strings.
If you are building any kind of multi-cloud cost analysis or want your Fabric costs to integrate cleanly with broader FinOps tooling, FOCUS is worth understanding.
What You Get
Once deployed, FCA provides Power BI reports covering:
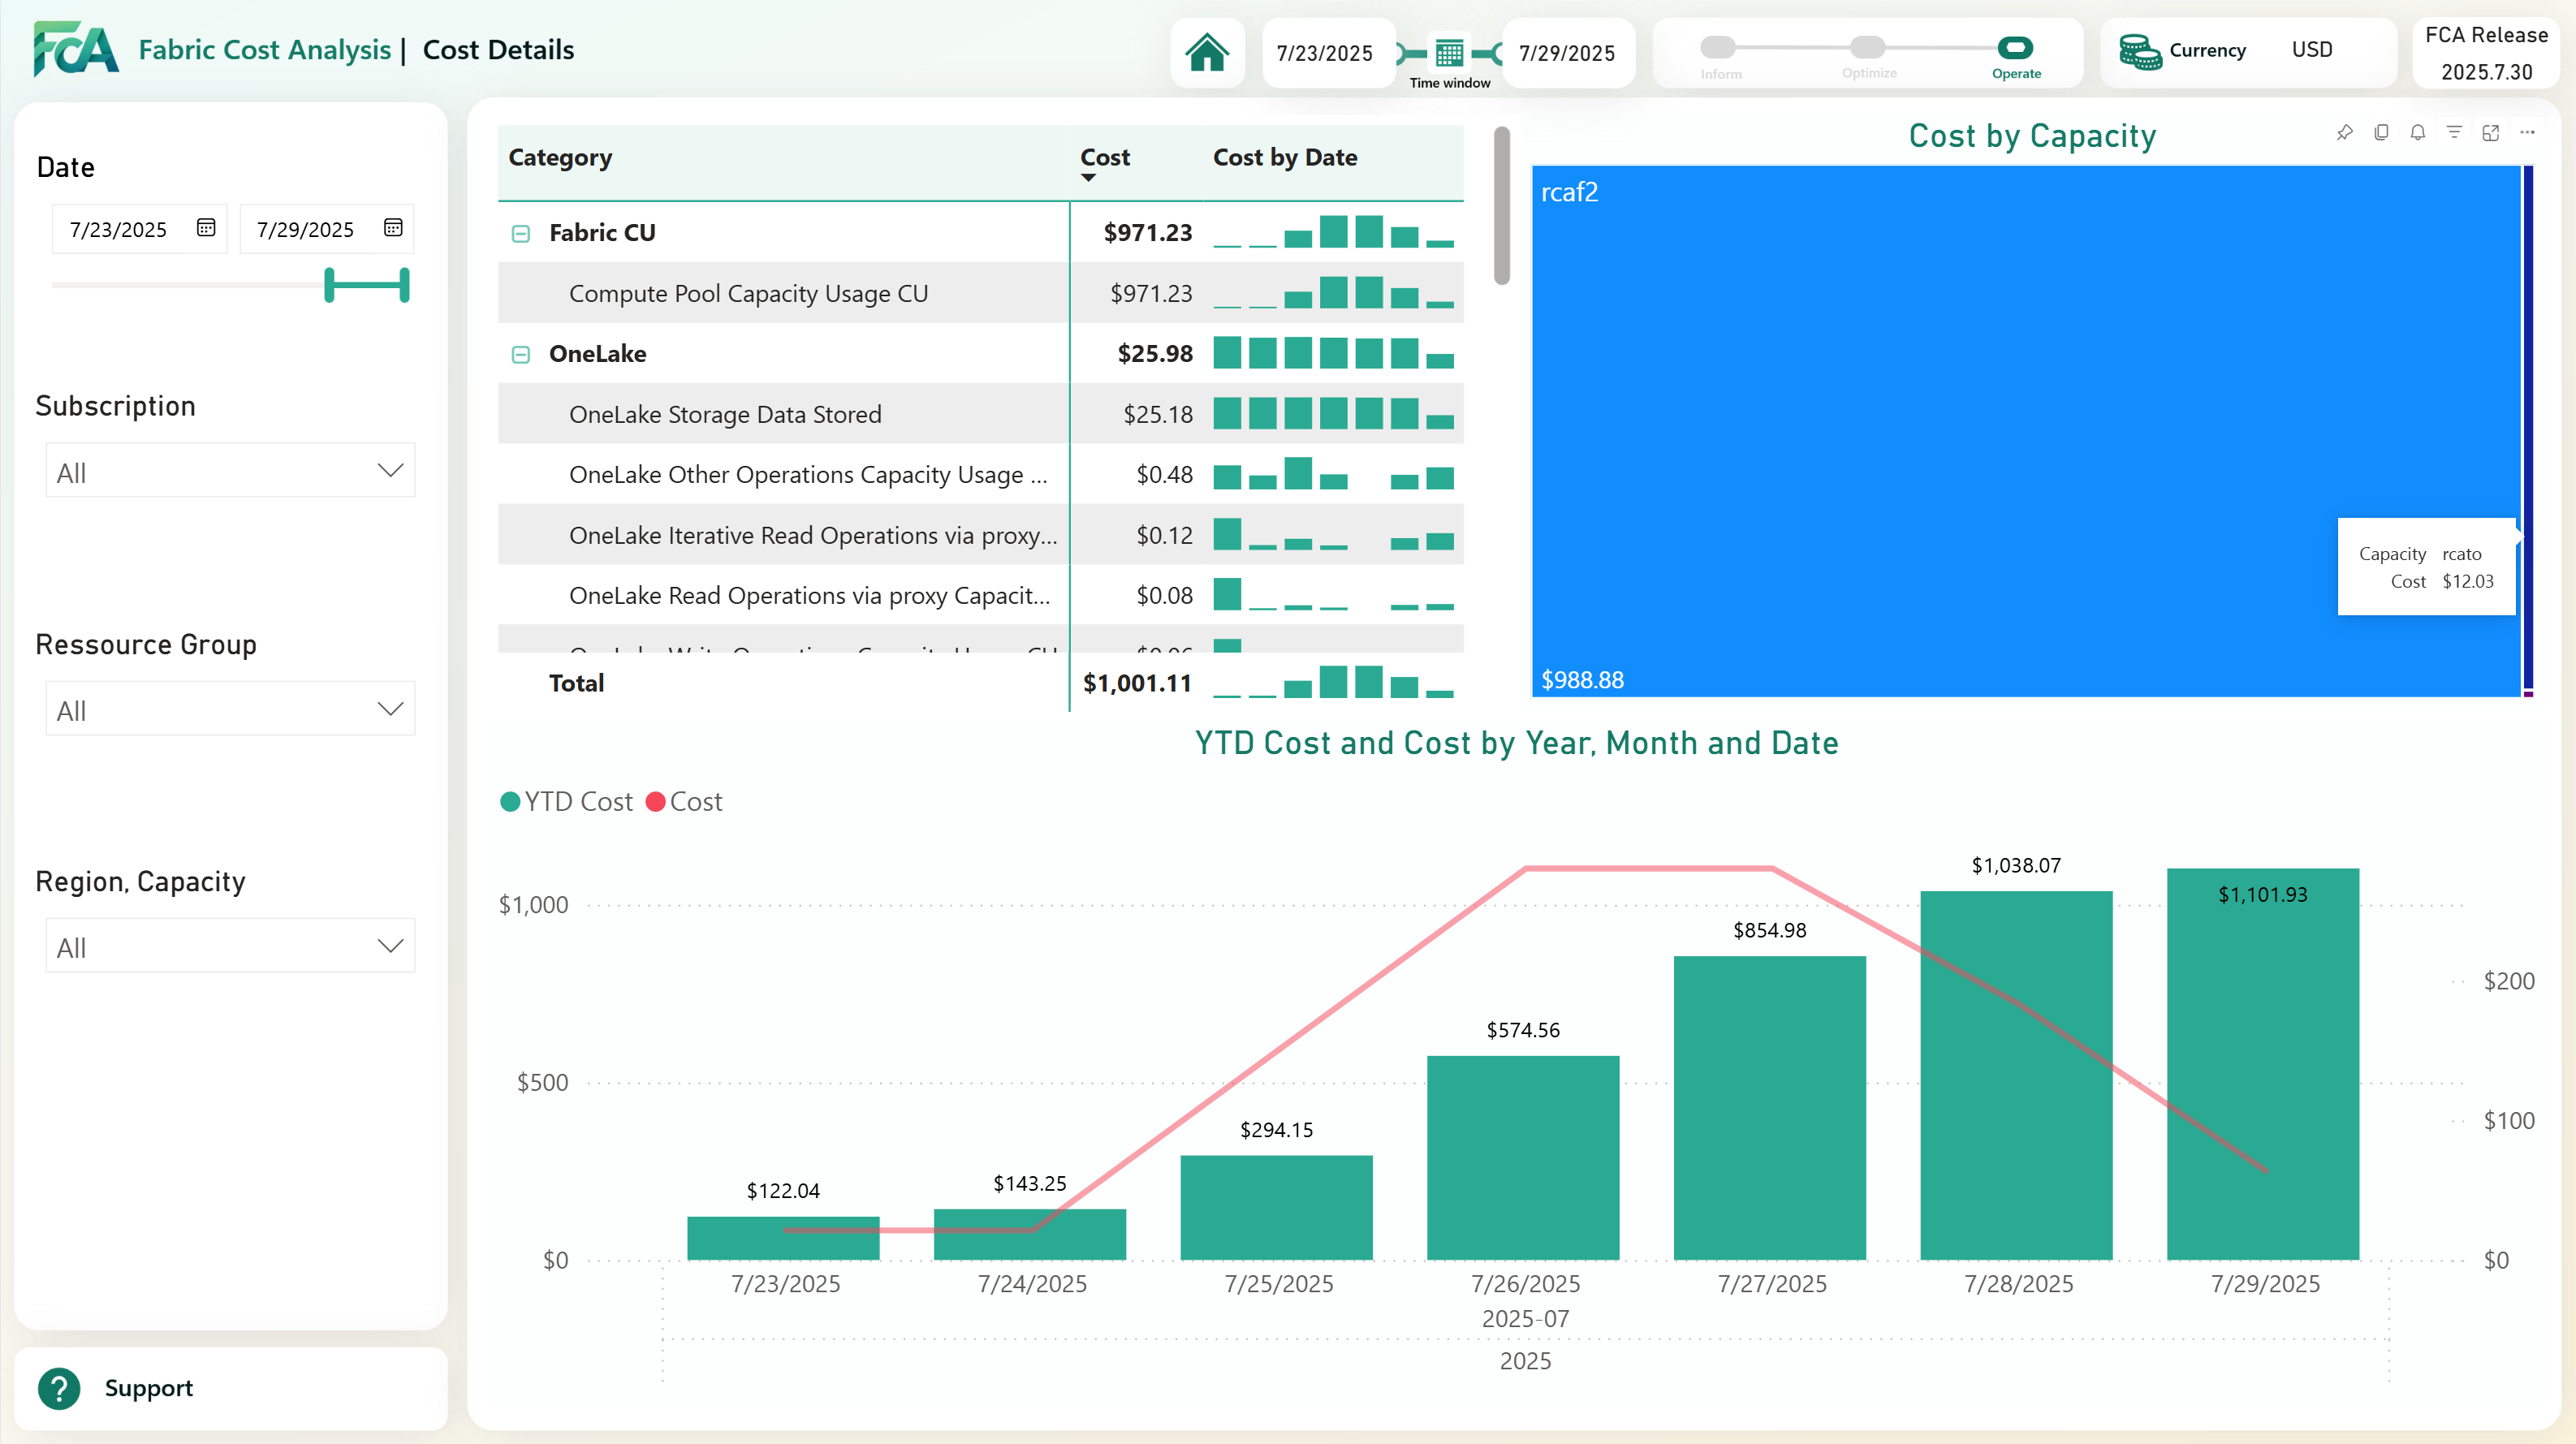
A Power Bi report showing cost breakdowns by capacity, workspace, and SKU, with trend analysis over time.
- An home overview dashboard with total costs
- A region focused dashboard
- A Capacity utilisation dashboard - excellent for identifying capacities that are note being used
- A reservation dashboard - for those with reserved capacity, this is a great way to see how well you are using it
- A Cost detail dashboard - for showing the year to date and further detailed breakdowns.
- A Quota dashboard - for showing the quota limits and usage of your capacities (if you have the permissions to get this data)
Here is one -
And An Agent for Natural language queries!
FCA also includes a data agent so that you can ask questions in English and in French which you can add to Teams :-)
How It Works
FCA imports cost export files from Azure Cost Management (in FOCUS format) into a Fabric Lakehouse, transforms the data using PySpark notebooks, and surfaces the results through Power BI reports.
The data collection is typically run daily or weekly — cost data in Azure is available with a day or two of delay, so real-time is not the focus here. Instead, FCA is about trend analysis and retrospective cost review.
Deployment Overview
- Configure Azure Cost Management to export cost data in FOCUS format to a storage location your Fabric can access
- Create a dedicated workspace for FCA in your Fabric tenant
- Run the setup notebooks from the
- Create shortcuts in the lakehouse to the storage accounts where the cost data is exported
- Schedule the data ingestion notebooks
This is a most super and wonderful solution that enables larger organisations to eget a great understanding of how their Fabric costs are being generated and by whom. It is a great example of how the fabric-toolbox ecosystem can provide ready-made solutions to common challenges in the Microsoft Fabric world.
I love it. Hat tip to the team that built it.
On Monday
On Monday we start the main event — a two-week deep dive into the MicrosoftFabricMgmt PowerShell module. 295+ cmdlets, 48 resource types, PSFramework logging, intelligent output formatting, pipeline support, and more. See you then.